: End Of Week Technicals - Bullish Continuation Or Correction To Be Started")
Hang Seng Index (HSI): End Of Week Technicals - Bullish Continuation Or Correction To Be Started

This
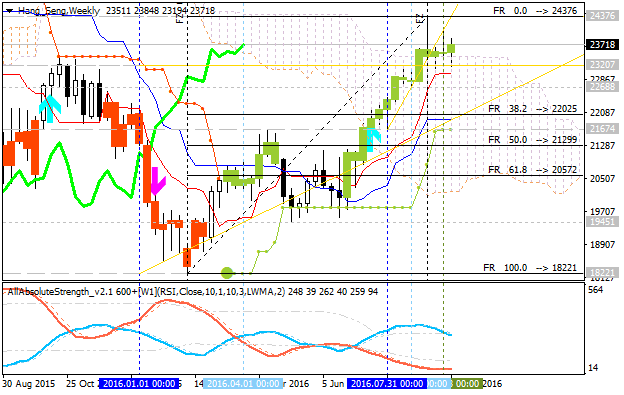
trading week is ended with some results concerning HSI: the price was
continuing with the daily bullish condition and started to be ranging
within narrow support/resistance levels for the direction of the bullish
continuation or the correction to the bearish reversal.
---------
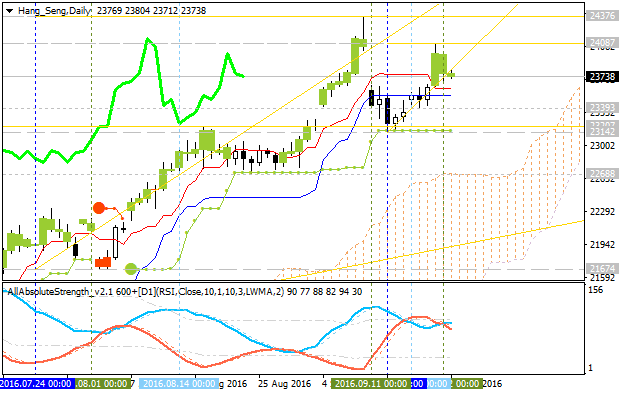
D1 price is located to be above Ichimoku cloud for the primary bullish market condition with the ranging within the following s/r levels:
- 24,087 resistance level located far above Ichimoku cloud in the bullish area of the chart, and
- 23,142 support level located in the beginning fo the ranging secondary correction to be started.
H4 price is on bullish within s/r levels with the secondary ranging market condition:
- Chinkou Span line is located above the price for for the possible breakdown in the near future.
- Absolute Strength indicator is estimating the ranging condition to be continuing.
- Ascending triangle pattern was formed by the price to be broken to above for the bullish.
- The nearest resistance levels for the bullish trend to be resumed are 24,087 and 24,376.
- Nearest support levels for the bearish reversal are 23,393 and 23,207.
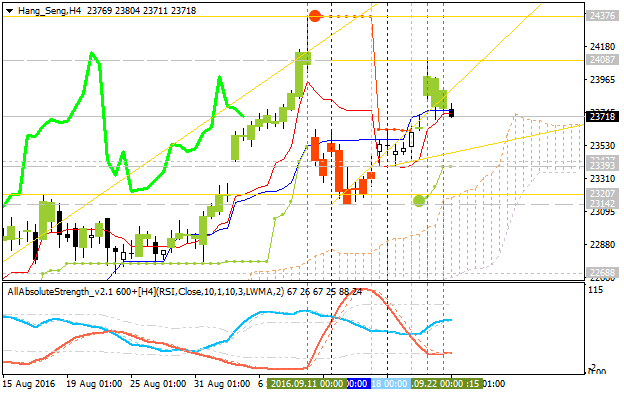
If H4 price breaks 24,087 resistance level so the primary bullish trend will be resumed with 24,376 possible bullish target.
If H4 price breaks 23,393 support so the local downtrend as the secondary ranging correction within the primary bullish trend will be started.
If H4 price breaks 23,207 support so we may see the bearish reversal to be started for this intra-day price movement.
If not so the price will be ranging within the levels.
| Resistance | Support |
|---|---|
| 24,087 | 23,393 |
| 24,376 | 23,207 |
SUMMARY : bullish