• Übersicht
  • Bewertungen
  • Diskussion

Wilders Average True Range for MT5

(Google-Übersetzung)

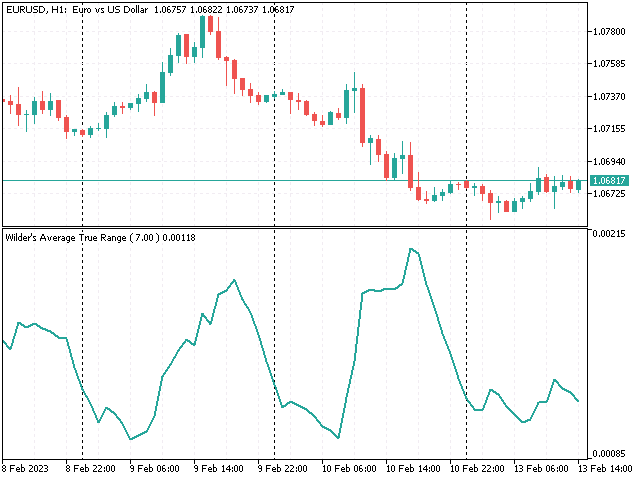
Dieser Indikator implementiert die ursprüngliche "Average True Range (ATR)", die von John Welles Wilder Jr. entwickelt wurde, wie in seinem Buch beschrieben— Neue Konzepte in technischen Handelssystemen [1978].

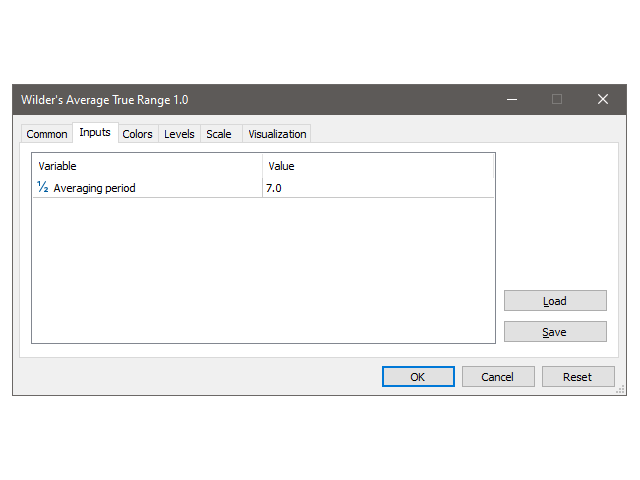
Es verwendet den gleitenden Durchschnitt von Wilder, auch bekannt als geglätteter gleitender Durchschnitt (SMMA), anstelle eines einfachen gleitenden Durchschnitts (SMA) wie auf dem eingebauten ATR-Indikator von MetaTrader verwendet. Der angewendete Standardzeitraum beträgt 7 statt 14, wie in der Beschreibung in seinem Buch beschrieben.

(Original text)

This indicator implements the original “Average True Range (ATR)” developed by John Welles Wilder Jr., as described in his book—New Concepts in Technical Trading Systems [1978].

It uses Wilder’s moving average, also known as the smoothed moving average (SMMA), instead of a simple moving average (SMA) as used on MetaTrader’s built-in ATR indicator. The default period applied is 7, instead of 14, as per the description in his book.

Empfohlene Produkte
An analogue of the Stochastic oscillator based on algorithms of singular spectrum analysis (SSA) SSA is an effective method to handle non-stationary time series with unknown internal structure. It is used for determining the main components (trend, seasonal and wave fluctuations), smoothing and noise reduction. The method allows finding previously unknown series periods and make forecasts on the basis of the detected periodic patterns. Indicator signals are identical to signals of the original i
FREE
Follow The Line MT5
Oliver Gideon Amofa Appiah
4.5 (28)
This indicator obeys the popular maxim that: "THE TREND IS YOUR FRIEND" It paints a GREEN line for BUY and also paints a RED line for SELL. (you can change the colors). It gives alarms and alerts of all kinds. IT DOES NOT REPAINT and can be used for all currency pairs and timeframes. Yes, as easy and simple as that. Even a newbie can use it to make great and reliable trades. NB: For best results, get my other premium indicators for more powerful and reliable signals. Get them here: https://www.m
FREE
Trend indicator based on the ADX / ADXWilder indicator The indicator shows trend areas using ADX or ADXWilder indicator data. How the indicator works: if PDI is greater than NDI, then it`s bullish movement; if PDI is less than NDI, then it`s bearish movement; if ADX is less than or equal to the filter value specified in the parameters, then there is no movement state. Input parameters of the indicator: Calculate Timeframe - timeframe for calculation; ADX Type - type of ADX calculation
FREE
Value Chart Candlesticks
Flavio Javier Jarabeck
4.67 (9)
The idea of a Value Chart indicator was presented in the very good book I read back in 2020 , " Dynamic Trading Indicators: Winning with Value Charts and Price Action Profile ", from the authors Mark Helweg and David Stendahl. The idea is simple and the result is pure genius: Present candlestick Price analysis in a detrended way! HOW TO READ THIS INDICATOR Look for Overbought and Oversold levels. Of course, you will need to test the settings a lot to find the "correct" one for your approach.
FREE
ToolBot Advisor Indicator
Josue De Matos Silva
4.5 (2)
ToolBot Advisor Indicator (RSI, ATR, ADX, OBV) FREE   An effective indicator for your negotiations The toolbot indicator and advisor brings leading (OBV) and lagging (RSI, ATR, ADX) indicators so that you have more security in your negotiations. In addition, it informs you of possible up and down trends as well as providing you with incredible advisors who will give you information about trading opportunities. With this indicator you will have more security and speed in your decision making
FREE
SSACD - Singular Spectrum Average Convergence/Divergence This is an analogue of the MACD indicator based on the Caterpillar-SSA ( Singular Spectrum Analysis ) method. Limited version of the SSACD Forecast indicator. Limitations include the set of parameters and their range. Specificity of the method The Caterpillar-SSA is an effective method to handle non-stationary time series with unknown internal structure. The method allows to find the previously unknown periodicities of the series and mak
FREE
Mitimom
Danil Poletavkin
The indicator is based on Robert Miner's methodology described in his book "High probability trading strategies" and displays signals along with momentum of 2 timeframes. A Stochastic oscillator is used as a momentum indicator. The settings speak for themselves period_1 is the current timeframe, 'current' period_2 is indicated - the senior timeframe is 4 or 5 times larger than the current one. For example, if the current one is 5 minutes, then the older one will be 20 minutes The rest of the
FREE
Donchian Channel DC is the indicator of Donchian Channels, that plots maximum and minimum values of a specific period, besides mean value line. It´s possible to configure simple period for analysis and the indicator will plot all three values. You can trade with this indicator as trend or reversal, according to each strategy. Do not let to test others indicators as soon as others expert advisors.
LT Donchian Channel
Thiago Duarte
4.75 (4)
Donchian Channel is an indicator created by Richard Donchian. It is formed by taking the highest high and the lowest low of the last specified period in candles. The area between high and low is the channel for the chosen period. Its configuration is simple. It is possible to have the average between the upper and lower lines, plus you have alerts when price hits one side. If you have any questions or find any bugs, please contact me. Enjoy!
FREE
This is addition of  Effective SV squeeze momentum  that add bolliger band and Keltner channel to chart window.  Squeeze momentum introduced by “John Carter”, the squeeze indicator for MT5 represents a volatility-based tool. Regardless, we can also consider the squeeze indicator as a momentum indicator, as many traders use it to identify the direction and strength of price moves. In fact, the Tradingview  squeeze indicator shows when a financial instrument is willing to change from a trending ma
FREE
Avi vertex
Alexey Viktorov
3.56 (9)
The indicator displays trend slowdown or possible end of trend and price reversal. The indicator has no parameters. When red bars appear and when they become shorter, we can talk about the approaching end of the downtrend. When green bars become shorter, we can expect the approaching end of the uptrend.
FREE
True Volatility
Cristian Eriksson
5 (1)
ATR is an excellent indicator to visualize if volatility is increasing or decreasing. But what if you want to compare the volatility to another pair or instrument? Since each pair with different quote currency has different pip value, the output of the ATR doesn't really say that much. Comparing pairs to other instruments is even harder.  What you as a trader care about is how much the pair has moved up or down in percentage, therefore normalizing ATR to percent would make things much easier.  T
FREE
Indicador Regressão Linear – Par de Ativos - INTRADAY Indicador é um oscilador que faz o plot do Resíduo resultado da regressão linear entre os dois ativos inseridos como input do indicador, representado pela fórmula: Y = aX + b + R Onde Y é o valor do ativo dependente, X é o valor do ativo independente, a é a inclinação da reta entre os dois ativos, b é a intersecção da reta e R é o resíduo. O resíduo representa a quantidade da variabilidade que Y que o modelo ajustado não consegue explicar. E
FREE
Bar Color Trend
Germano Chagas
4.5 (6)
Combining the best of Price Action , Directional Movement , and Divergence/Convergence analysis, Candle Color Trend is a easy and reliable way to identify trend direction. The indicator automatically paints the candles according to the assumption that an uptrend is defined by prices that form a series of higher highs and higher lows. In contrast, a downtrend is defined by prices that form a series of lower highs and lower lows. Additionally, ADX Wilder indicator is used to measure trend weakness
FREE
Multi-timeframe trend indicator based on the ADX / ADXWilder indicator with Fibonacci levels The indicator shows trend areas using ADX or ADXWilder indicator data from multiple timeframes. The impulse mode of the indicator allows you to catch the beginning of a trend, and several "Screens" with different timeframes allow you to filter out market noise. Fibonacci levels are added to the price chart, which have flexible settings. How the indicator works: if PDI is greater than NDI, then   it`
FREE
The Moving Averages On-Off  let you  control the indicator  using  the keyboard  or a  button . You can choose if you want the indicator always shown or always hided while switching among different time frames or financial instruments .    --->  This indicator is part of Combo Indicator OnOff It's possible to  setup three Moving Averages : Short ,  Medium ,  Long   Input You can customize the price type used for calculation : close, open, high, low, median price, typical price, weighted It
FREE
Menora Indicator
Arnold Kurapa
4 (1)
Menora (All In One) Indicator. This is the advanced and premium indicator for the Magic Trend, a free indicator.  It has 3 output signals driven by different market conditions. This indicator has a double function of working as an indicator and utility at the same time. Specifications  1]  3 output signals a) Slow Moving Average with color change - The MA has a non-repaint color change, which makes it perfect for entry signals. b) Fast Moving Average (the original Magic Trend line) - Give
FREE
FractalEfficiencyIndicator   A ratio between 0 and 1 with the higher values representing a more efficient or trending market,  It is used in the calculation of Perry J. Kaufman Adaptive Moving Average (KAMA), dividing the price change over a period by the absolute sum of the price movements that occurred to achieve that change. The Fractal Efficiency or also known as Efficiency Ratio was first published by Perry J. Kaufman in his book   ‘Smarter Trading‘. This is mostly considered a filter for v
FREE
FVG Indicator
Daniel Moises Pimentel Flores
This indicator identifies and highlights market inefficiencies, known as Fair Value Gaps (FVG), on price charts. Using a custom algorithm, the indicator detects these areas of imbalance where the price moves sharply, creating potential trading opportunities. Indicator Parameters: Bullish FVG Color (clrBlue) : Color used to highlight bullish inefficiencies. The default value is blue. Bearish FVG Color (clrRed) : Color used to highlight bearish inefficiencies. The default value is red. Bullish FVG
FREE
(Google-Übersetzung) Dieser Indikator basiert auf dem ursprünglichen " Time Segmented Volume (TSV) ", das von Worden Brothers, Inc entwickelt wurde. Allerdings habe ich diesem ein paar zusätzliche Funktionen hinzugefügt. Man kann den anzuwendenden Preis wählen, anstatt nur den standardmäßigen Schlusskurs zu haben, der vom Original verwendet wird. Man kann auch wählen, welche Volumengewichtung verwendet werden soll, einschließlich eines Pseudo-Volumens basierend auf der wahren Reichweite, oder üb
FREE
Dsc Oscillator
Diogo Sawitzki Cansi
Recomended broker: https://tinyurl.com/5ftaha7c Indicator used to monitor price fluctuations in the market and discover possible reversals through reversal points or divergences in the indicator. All assets and all timeframes.   SEE OUR RESULTS ON INSTAGRAM:  https://www.instagram.com/diogo.cansi/   TELEGRAM GROUP =  https://t.me/robosdsc More information by email dscinvestimentos@gmail.com or by Whatsapp 55-991372299
FREE
FT ROC Histogram
FLEK TRADING s.r.o.
3 (1)
The indicator displays the value of ROC (Rate of change) from the selected price or moving average as a histogram. You can plot the moving average ROC values for smoothing indicator. Displayed Data ExtROC - rate of change ExtMAROC - smoothing line Parameters You can change the price, on which the indicator is calculated. Inputs InpMAPeriod - in case you want to calculate the moving average ROC, enter averaging period. Enter 1 for the calculation of the specified prices. InpMAMethod - smoot
FREE
MWC COX 5
Joerg Hamann
3 (1)
The MWC COX indicator shows the extreme zones of net short/long positions of the Commitments of Traders Report released by the CFTC once a week for four periods of time. Default settings are periods of 12, 26, 52 and 156 weeks. Additional Features Displays the sum of all 4 periods in one line MA, MOM and RSI indicators are integrated ( not in the MQL5 Version 1.0 ) Please make sure that you download the MWC_Demo.zip file and unpack it into   [...]/MQL5/Files   folder.  ->  www.myweeklycot.com/
FREE
Bollinger Bands Technical Indicator (BB) is similar to envelopes. The only difference is that the bands of Envelopes are plotted a fixed distance (%) away from the moving average, while the Bollinger Bands are plotted a certain number of standard deviations away from it. Standard deviation is a measure of volatility, therefore Bollinger Bands adjust themselves to the market conditions. When the markets become more volatile, the bands widen and they contract during less volatile periods. This ada
FREE
Volatility Doctor RSI
Gamuchirai Zororo Ndawana
Wir präsentieren den Volatility Doctor RSI, ein bahnbrechendes Tool, das auf dem vertrauenswürdigen RSI-Indikator aufbaut und entwickelt wurde, um Ihre Handelserfahrung wie nie zuvor zu verbessern. Unser Indikator liefert nicht nur Echtzeit-RSI-Daten, sondern bietet auch eine präzise Prognose, wo der RSI-Wert in 10 Schritten in der Zukunft auf einem beliebigen Zeitrahmen und Symbol sein wird. Adaptive Intelligenz: Dieses Tool lernt und passt sich jedem Markt an, integriert sich nahtlos in
FREE
Ribbon Trend for MT5
Sutthichai Mungdee
5 (4)
This indicator is a simple tool to spot a possible trend. When the ribbon below the price bars, It will turn to Green color and the trend is seen to be bullish When the   ribbon above the price bars, it will turn to Red color and the trend is seen to be bearish. It can be used a either Entry Signal Exit Signal or trailing stop, so it is very versatile. By default color : Green is UP trend and Red is Down trend and this work perfect with   Bar4Colors.ex5
FREE
RSI Currencies is an indicator that is based on the RSI concept but with a totally different approach. It calculates its values calculating all RSI values of all pairs related to the same currency and making an average between them: the goal is to obtain a more solid and trustable information about what each currency are doing lowering the impact of market noise and extreme euphory on a particular pair to analyze the whole basket. It works on 28 forex majors and minor pairs related to these curr
FREE
Multi-timeframe trend indicator, based on the ADX / ADXWilder indicator The indicator shows trend areas using ADX or ADXWilder indicator data from multiple timeframes. The impulse mode of the indicator allows you to catch the beginning of a trend, and several "Screens" with different timeframes allow you to filter out market noise. How the indicator works: if PDI is greater than NDI, then it`s bullish movement; if PDI is less than NDI, then it`s bearish movement; to determine any trend, it
FREE
Dual RSI
Paul Conrad Carlson
3 (1)
Indicator alerts for Dual Relative strength index rsi. Large rsi preset at 14 is below 30 small rsi preset at 4 is below 10 for buy bullish signals . Large rsi preset are 14 is above 70 small rsi preset at 4 is above 90 for sell bearish signals . Includes mobile and terminal alerts. draws lines when alerts. This indicator can help identify extremes and then the tops or bottoms of those extremes .
FREE
Important Lines
Terence Gronowski
4.85 (20)
Important Lines Indikator (M1 - M15) Dieser Indikator zeigt Pivot-Lines, vortages Hoch und Tief, vortages Close und das Minimum und Maximum der vorherigen Stunde an. Sie müssen nur diesen einzelnen Indikator in das Diagramm ziehen, um alle diese wichtigen Linien zu haben. Sie können sich das Laden vieler einzelnen Indikatoren ersparen. Warum sind bestimmte Linien beim Traden so wichtig? Vortageshoch und -tief: Diese werden von Händlern beobachtet, die in einer Tages-Chart handeln. Sehr of
FREE
Käufer dieses Produkts erwarben auch
TPSpro RFI Levels MT5
Roman Podpora
4.73 (11)
ANWEISUNGEN       Russland       -        ENG    Die Empfehlung basiert auf dem Indikator -   TPSpro   TREND PRO -   Version MT5 Die wichtigsten Elemente in der Branche sind entweder in Zonen oder in der Fabrik enthalten, oder sie führen zu einer Lösung bei einem Kauf oder dem Verkauf eines anderen Instruments. Wenn viele Menschen ihre Rechte nicht auf dem Händlerkonto verschlüsseln, werden die Folgen nicht schnell genug sein. Ich habe es damit abgeschlossen, dass ich diese Folgen nun noch inter
TPSproTREND PrO MT5
Roman Podpora
4.89 (9)
TPSpro TREND PRO   ist ein Trendindikator, der den Markt automatisch analysiert und Informationen über den Trend und jede seiner Änderungen liefert sowie Signale für den Einstieg in Geschäfte ohne Neuzeichnung gibt! Der Indikator verwendet jede Kerze und analysiert sie separat. bezieht sich auf verschiedene Impulse – Aufwärts- oder Abwärtsimpuls. Exakte Einstiegspunkte in Transaktionen für Währungen, Krypto, Metalle, Aktien, Indizes! Version MT5                   VOLLSTÄNDIGE BESCHREIBUNG DES I
Atomic Analyst MT5
Issam Kassas
4.42 (19)
Zunächst einmal ist es erwähnenswert, dass dieser Handelsindikator nicht neu malt, nicht neu zeichnet und keine Verzögerung aufweist, was ihn sowohl für manuellen als auch für Roboterhandel ideal macht. Benutzerhandbuch: Einstellungen, Eingaben und Strategie. Der Atom-Analyst ist ein PA-Preisaktionsindikator, der die Stärke und das Momentum des Preises nutzt, um einen besseren Vorteil auf dem Markt zu finden. Ausgestattet mit fortschrittlichen Filtern, die helfen, Rauschen und falsche Signale z
Atbot
Zaha Feiz
4.91 (34)
AtBot: Wie es funktioniert und wie man es benutzt ### Wie es funktioniert Der "AtBot"-Indikator für die MT5-Plattform generiert Kauf- und Verkaufssignale mithilfe einer Kombination von technischen Analysetools. Er integriert den einfachen gleitenden Durchschnitt (SMA), den exponentiellen gleitenden Durchschnitt (EMA) und den Durchschnitt der wahren Reichweite (ATR)-Index, um Handelsmöglichkeiten zu identifizieren. Darüber hinaus kann er Heikin Ashi-Kerzen verwenden, um die Signalgenauigkeit zu
Gold Stuff mt5
Vasiliy Strukov
4.92 (165)
Gold Stuff mt5-Ein Trendindikator, der speziell für Gold entwickelt wurde, kann auch auf allen Finanzinstrumenten verwendet werden. Der Indikator wird nicht neu gezeichnet und verzögert sich nicht. Empfohlener Zeitrahmen H1. WICHTIG! Kontaktieren Sie mich sofort nach dem Kauf, um Anweisungen und Bonus zu erhalten!     Sie können eine kostenlose Kopie unseres Strong Support- und Trendscanner-Indikators erhalten, bitte senden Sie uns eine persönliche Nachricht. Mich! DATEN Draw Arrow - in
Zunächst einmal ist es wichtig zu betonen, dass dieses Handelssystem ein Nicht-Repainting-, Nicht-Redrawing- und Nicht-Verzögerungsindikator ist, was es sowohl für manuelles als auch für automatisches Trading ideal macht. Online-Kurs, Handbuch und Vorlagen herunterladen. Das "Smart Trend Trading System MT5" ist eine umfassende Handelslösung, die für neue und erfahrene Trader maßgeschneidert ist. Es kombiniert über 10 Premium-Indikatoren und bietet mehr als 7 robuste Handelsstrategien, was es zu
Quantum Trend Sniper
Bogdan Ion Puscasu
4.8 (49)
Wir stellen vor       Quantum Trend Sniper Indicator   , der bahnbrechende MQL5-Indikator, der die Art und Weise, wie Sie Trendumkehrungen erkennen und handeln, verändert! Entwickelt von einem Team erfahrener Händler mit über 13 Jahren Handelserfahrung,       Quantum Trend Sniper-Indikator       wurde entwickelt, um Ihre Trading-Reise mit seiner innovativen Methode zur Identifizierung von Trendumkehrungen mit extrem hoher Genauigkeit auf ein neues Niveau zu heben. ***Kaufe Quantum Trend Snipe
Dieses Dashboard zeigt die   neuesten verfügbaren harmonischen   Muster für die ausgewählten Symbole, so dass Sie Zeit sparen und effizienter sein werden /   MT4-Version . Kostenloser Indikator:   Basic Harmonic Pattern Spalten des Indikators Symbol:   die ausgewählten Symbole werden angezeigt Trend:   bullish oder bearish Pattern :   Art des Musters (Gartley, Schmetterling, Fledermaus, Krabbe, Hai, Cypher oder ABCD) Entry :   Einstiegskurs SL:   Stop-Loss-Kurs TP1:   1. Take-Profit-Kurs
FX Power MT5 NG
Daniel Stein
5 (5)
Erhalten Sie Ihr tägliches Marktupdate mit Details und Screenshots über unser Morning Briefing hier auf mql5 und auf Telegram ! FX Power MT5 NG ist die nächste Generation unseres langjährig sehr beliebten Währungsstärkemessers FX Power. Und was bietet dieser Stärkezähler der nächsten Generation? Alles, was Sie am ursprünglichen FX Power geliebt haben PLUS GOLD/XAU-Stärkeanalyse Noch präzisere Berechnungsergebnisse Individuell konfigurierbare Analysezeiträume Anpassbares Berechnungslimit für noc
Trend Screener Pro MT5
STE S.S.COMPANY
4.87 (63)
Nutzen Sie die Macht des Trendhandels mit Trend Screener Indicator: Ihrer ultimativen Trendhandelslösung, die auf Fuzzy-Logik und einem System mit mehreren Währungen basiert! Steigern Sie Ihren Trendhandel mit Trend Screener, dem revolutionären Trendindikator mit Fuzzy-Logik. Es handelt sich um einen leistungsstarken Trendfolgeindikator, der über 13 Premium-Tools und -Funktionen sowie 3 Handelsstrategien kombiniert und ihn zu einer vielseitigen Wahl macht, um Ihren Metatrader in einen Trendanaly
Zunächst einmal ist es wichtig zu betonen, dass dieses Handelstool ein Nicht-Repaint-, Nicht-Redraw- und Nicht-Verzögerungsindikator ist, was es ideal für professionelles Trading macht. Online-Kurs, Benutzerhandbuch und Demo. Der Smart Price Action Concepts Indikator ist ein sehr leistungsstarkes Werkzeug sowohl für neue als auch erfahrene Händler. Er vereint mehr als 20 nützliche Indikatoren in einem und kombiniert fortgeschrittene Handelsideen wie die Analyse des Inner Circle Traders und S
AT Forex Indicator MT5
Marzena Maria Szmit
5 (4)
The AT Forex Indicator MT5 is a sophisticated trading tool designed to provide traders with a comprehensive analysis of multiple currency pairs. This powerful indicator simplifies the complex nature of the forex market, making it accessible for both novice and experienced traders. AT Forex Indicator uses advanced algorithms to detect trends, patterns and is an essential tool for traders aiming to enhance their forex trading performance. With its robust features, ease of use, and reliable signal
TrendMaestro5
Stefano Frisetti
note: this indicator is for METATRADER4, if you want the version for METATRADER5 this is the link:  https://www.mql5.com/it/market/product/108106 TRENDMAESTRO ver 2.4 TRENDMAESTRO recognizes a new TREND in the bud, he never makes mistakes. The certainty of identifying a new TREND is priceless. DESCRIPTION TRENDMAESTRO identifies a new TREND in the bud, this indicator examines the volatility, volumes and momentum to identify the moment in which there is an explosion of one or more of these data a
ATrend
Zaha Feiz
4.8 (5)
ATREND: How It Works and How to Use It How It Works The " ATREND " indicator for the MT5 platform is designed to provide traders with robust buy and sell signals by utilizing a combination of technical analysis methodologies. This indicator primarily leverages the Average True Range (ATR) for volatility measurement, alongside trend detection algorithms to identify potential market movements. Leave a massage after purchase and receive a special bonus gift. 8 copies left for 30$ price  Key Fe
Der Forex TPA Indikator deckt die wahren Aktionen der Marktmacher auf, immer dann wenn sie passieren. "Kämpfe nicht gegen die Marktmacher an, sondern folge ihnen", ist wohl der beste Rat, den ein Trader bekommen kann. Der TPA Indikator zeigt jedesmal seine Signale an wenn die Bullen definitiv stärker sind als die Bären und umgekehrt. Dieser Indikator wurde VON Tradern FÜR Trader gemacht und ist 100% NICHT NACHZEICHNEND! Signale werden STRENG am Schluss einer Kerze  generiert. Das sagen unsere Ku
FxaccurateLS
Shiv Raj Kumawat
WHY IS OUR FXACCCURATE LS MT5 THE PROFITABLE ? PROTECT YOUR CAPITAL WITH RISK MANAGEMENT Gives entry, stop and target levels from time to time. It finds Trading opportunities by analyzing what the price is doing during established trends. POWERFUL INDICATOR FOR A RELIABLE STRATEGIES We have made these indicators with a lot of years of hard work. It is made at a very advanced level. Established trends provide dozens of trading opportunities, but most trend indicators completely ignore them!
Auto Order Block with break of structure based on ICT and Smart Money Concepts (SMC) Futures Break of Structure ( BoS )             Order block ( OB )            Higher time frame Order block / Point of Interest ( POI )    shown on current chart           Fair value Gap ( FVG ) / Imbalance   -  MTF      ( Multi Time Frame )    HH/LL/HL/LH  -  MTF      ( Multi Time Frame )  Choch  MTF      ( Multi Time Frame )  Volume Imbalance     ,  MTF          vIMB Gap’s Power of 3 Equal High
Advanced Supply Demand MT5
Bernhard Schweigert
4.5 (14)
Derzeit 33% Rabatt! Die beste Lösung für jeden Anfänger oder erfahrenen Händler! Dieser Indikator ist ein einzigartiges, qualitativ hochwertiges und erschwingliches Trading-Tool, da wir eine Reihe von proprietären Funktionen und eine neue Formel integriert haben. Mit diesem Update werden Sie in der Lage sein, doppelte Zeitrahmenzonen anzuzeigen. Sie können nicht nur einen höheren TF (Zeitrahmen) anzeigen, sondern sowohl den Chart-TF als auch den höheren TF: SHOWING NESTED ZONES. Alle Supply Dema
ICT, SMC, SMART MONEY CONCEPTS, SMART MONEY, Smart Money Concept, Support and Resistance, Trend Analysis, Price Action, Market Structure, Order Blocks, BOS/CHoCH,   Breaker Blocks ,  Momentum Shift,   Supply&Demand Zone/Order Blocks , Strong Imbalance,   HH/LL/HL/LH,    Fair Value Gap, FVG,  Premium  &   Discount   Zones, Fibonacci Retracement, OTE, Buy Side Liquidity, Sell Side Liquidity, BSL/SSL Taken, Equal Highs & Lows, MTF Dashboard, Multiple Time Frame, BigBar, HTF OB, HTF Market Structure
ICT, SMC, Smart Money Concept, Support and Resistance, Trend Analysis, Price Action, Market Structure, Order Blocks, Breaker Blocks, Momentum Shift, Strong Imbalance, HH/LL/HL/LH, Fair Value Gap, FVG, Premium & Discount Zones, Fibonacci Retracement, OTE, Buyside Liquidity, Sellside Liquidity, Liquidity Voids, Market Sessions, NDOG, NWOG,Silver Bullet,ict template Auf dem Finanzmarkt ist eine genaue Marktanalyse für Investoren von entscheidender Bedeutung. Um Investoren dabei zu helfen, Marktt
Black Dragon indicator mt5
Ramil Minniakhmetov
4.81 (53)
Der Trenderkennungsindikator ergänzt jede Strategie und kann auch als unabhängiges Werkzeug verwendet werden. Vorteile Einfach zu bedienen, überfrachtet das Diagramm nicht mit unnötigen Informationen; Kann als Filter für jede Strategie verwendet werden; Verfügt über eingebaute dynamische Unterstützungs- und Widerstandsebenen, die sowohl zur Gewinnmitnahme als auch zum Setzen von Stop-Loss verwendet werden können; Der Indikator ändert seine Farbe nicht, nachdem die Kerze geschlossen wurde;
Dies ist ein Indikator für MT5, der genaue Signale für den Einstieg in einen Handel ohne Repainting (Neuzeichnen) liefert. Er kann auf alle Finanzwerte angewendet werden: Forex, Kryptowährungen, Metalle, Aktien, Indizes. Er liefert ziemlich genaue Schätzungen und sagt Ihnen, wann es am besten ist, eine Position zu eröffnen und zu schließen. Sehen Sie sich das Video (6:22) mit einem Beispiel für die Verarbeitung nur eines Signals an, das sich für den Indikator gelohnt hat! Die meisten Händler ver
Matrix Arrow Indicator MT5
Juvenille Emperor Limited
5 (12)
Matrix Arrow Indicator MT5   ist ein einzigartiger 10-in-1-Trend, der zu   100 % nicht neu gezeichnet   werden kann. Multi-Timeframe-Indikator, der für alle Symbole/Instrumente verwendet werden kann:   Forex ,   Rohstoffe ,   Kryptowährungen ,   Indizes ,   Aktien .  Der  Matrix Arrow Indicator MT5  wird den aktuellen Trend in seinen frühen Stadien bestimmen und Informationen und Daten von bis zu 10 Standardindikatoren sammeln, die sind: Durchschnittlicher Richtungsbewegungsindex (ADX) Rohstoff
IX Power MT5
Daniel Stein
4.17 (6)
IX Power   bringt die unschlagbare Präzision von FX Power endlich auch zu Nicht-Forex-Symbolen. Es bestimmt präzise die Intensität von kurz-, mittel- und langfristigen Trends in Ihren Lieblingsindizes, Aktien, Rohstoffen, ETFs und sogar Kryptowährungen. Sie können   alles analysieren, was   Ihr Terminal zu bieten hat. Probieren Sie es aus und erleben Sie, wie   sich Ihr Timing   beim Handel   deutlich verbessert . IX Power Hauptmerkmale 100% präzise, nicht nachpinselnde Berechnungsergebni
Blahtech Supply Demand MT5
Blahtech Limited
4.54 (13)
Was: $299  Now: $99   Supply Demand uses previous price action to identify potential imbalances between buyers and sellers. The key is to identify the better odds zones, not just the untouched ones. Blahtech Supply Demand indicator delivers functionality previously unavailable on any trading platform. This 4-in-1 indicator not only highlights the higher probability zones using a multi-criteria strength engine, but also combines it with multi-timeframe trend analysis, previously confirmed swings
** All Symbols x All Timeframes scan just by pressing scanner button ** *** Contact me  to send you instruction and add you in "123 scanner group" for sharing or seeing experiences with other users. After 17 years of experience in the markets and programming, Winner indicator is ready. I would like to share with you! Introduction The 123 Pattern Scanner indicator with a special enhanced algorithm is a very repetitive common pattern finder with a high success rate . Interestingly, this Winner in
Stratos Pali mt5
Michela Russo
5 (1)
Stratos Pali Indicator is a revolutionary tool designed to enhance your trading strategy by accurately identifying market trends. This sophisticated indicator uses a unique algorithm to generate a complete histogram, which records when the trend is Long or Short. When a trend reversal occurs, an arrow appears, indicating the new direction of the trend. Important Information Revealed Leave a review and contact me via mql5 message to receive My Top 5 set files for Stratos Pali at no cost ! Do
Was: $249  Now: $99   Market Profile defines a number of day types that can help the trader to determine market behaviour. A key feature is the Value Area, representing the range of price action where 70% of trading took place. Understanding the Value Area can give traders valuable insight into market direction and establish the higher odds trade. It is an excellent addition to any system you may be using. Inspired by Jim Dalton’s book “Mind Over Markets”, this indicator is designed to suit the
PZ Swing Trading MT5
PZ TRADING SLU
5 (4)
Swing Trading ist der erste Indikator, der Schwankungen in Trendrichtung und mögliche Umkehrschwankungen erkennt. Es wird der in der Handelsliteratur weit verbreitete Baseline-Swing-Trading-Ansatz verwendet. Der Indikator untersucht mehrere Preis- und Zeitvektoren, um die aggregierte Trendrichtung zu verfolgen und erkennt Situationen, in denen der Markt überverkauft oder überkauft ist und zur Korrektur bereit ist. [ Installationsanleitung | Update-Anleitung | Fehlerbehebung | FAQ | Alle Produkte
FX Volume MT5
Daniel Stein
4.93 (14)
Erhalten Sie Ihr tägliches Marktupdate mit Details und Screenshots über unser Morning Briefing hier auf mql5 und auf Telegram ! FX Volume ist der ERSTE und EINZIGE Volumenindikator, der einen ECHTEN Einblick in die Marktstimmung aus Sicht eines Brokers bietet. Es bietet fantastische Einblicke in die Positionierung von institutionellen Marktteilnehmern, wie z.B. Brokern, auf dem Forex-Markt, viel schneller als COT-Berichte. Diese Informationen direkt auf Ihrem Chart zu sehen, ist der wahre Game
Weitere Produkte dieses Autors
Doteki Heikin Ashi for MT5
Fernando Carreiro
3.5 (4)
(Google-Übersetzung) Die standardmäßige Heikin Ashi -Kerzendarstellung hat einen offenen Wert, der einem Exponential entspricht Gleitender Durchschnitt (EMA) des Gesamtpreises , von dem der Alpha -Wert des EMA festgelegt ist bei 0,5 (entspricht einer EMA -Periode von 3,0). In dieser dynamischen Version kann der Punkt auf einen beliebigen Wert geändert werden, den man verwenden möchte, was einem auch erlaubt ist ungefähre Multi-Time-Frame-Analyse oder verwenden Sie den niedrigen oder hohen Wert a
FREE
(Google-Übersetzung) Dieser Indikator basiert auf dem ursprünglichen " Time Segmented Volume (TSV) ", das von Worden Brothers, Inc entwickelt wurde. Allerdings habe ich diesem ein paar zusätzliche Funktionen hinzugefügt. Man kann den anzuwendenden Preis wählen, anstatt nur den standardmäßigen Schlusskurs zu haben, der vom Original verwendet wird. Man kann auch wählen, welche Volumengewichtung verwendet werden soll, einschließlich eines Pseudo-Volumens basierend auf der wahren Reichweite, oder üb
FREE
(Google Übersetzer) Dieser Indikator wurde von John Welles Wilders Average True Range (ATR) inspiriert, jedoch mit einigen zusätzlichen Informationen. Auf ähnliche Weise wird der exponentielle gleitende Durchschnitt der wahren Spannweite berechnet, jedoch unter Verwendung der Standard-Alpha-Gewichtung anstelle von Wilders . Es berechnet auch die durchschnittliche Abweichung des Bereichsdurchschnitts und zeigt sie als Offset an. Dies hilft nicht nur, eine Änderung schneller zu erkennen, sondern a
FREE
(Google-Übersetzung) Dieser Indikator basiert auf dem ursprünglichen " Time Segmented Volume (TSV) ", das von Worden Brothers, Inc entwickelt wurde. Allerdings habe ich diesem ein paar zusätzliche Funktionen hinzugefügt. Man kann den anzuwendenden Preis wählen, anstatt nur den standardmäßigen Schlusskurs zu haben, der vom Original verwendet wird. Man kann auch wählen, welche Volumengewichtung verwendet werden soll, einschließlich eines Pseudo-Volumens basierend auf der wahren Reichweite, oder üb
FREE
(Google-Übersetzung) Dieser Indikator implementiert die ursprüngliche " Average True Range (ATR) ", die von John Welles Wilder Jr. entwickelt wurde, wie in seinem Buch beschrieben— Neue Konzepte in technischen Handelssystemen [1978] . Es verwendet den gleitenden Durchschnitt von Wilder , auch bekannt als geglätteter gleitender Durchschnitt (SMMA) , anstelle eines einfachen gleitenden Durchschnitts (SMA) wie auf dem eingebauten ATR -Indikator von MetaTrader verwendet. Der angewendete Standardzeit
FREE
(Google Übersetzer) Dieser Indikator wurde von John Welles Wilders Average True Range (ATR) inspiriert, jedoch mit einigen zusätzlichen Informationen. Auf ähnliche Weise wird der exponentielle gleitende Durchschnitt der wahren Spannweite berechnet, jedoch unter Verwendung der Standard-Alpha-Gewichtung anstelle von Wilders . Es berechnet auch die durchschnittliche Abweichung des Bereichsdurchschnitts und zeigt sie als Offset an. Dies hilft nicht nur, eine Änderung schneller zu erkennen, sondern a
FREE
(Automatische Übersetzung) Die meisten Händler kennen den berühmten japanischen Heikin-Ashi- Indikator, der im 18. Jahrhundert von Munehisa Homma entwickelt wurde. Es wird manchmal Heiken-Ashi geschrieben, aber seine Bedeutung bleibt dieselbe, nämlich „durchschnittlicher Balken“ auf Japanisch. Dies ist eine Implementierung des sehr bekannten Heikin-Ashi- Indikators, jedoch mit einigen zusätzlichen Funktionen. Zum einen ermöglicht es die Gewichtung seiner Werte nach dem Volumen , sei es das Tick-
(Google-Übersetzung) Dieser Indikator basiert auf dem ursprünglichen ZigZag , das als Quellcodebeispiel mit MetaTrader -Installationen bereitgestellt wird. Ich habe es mit einigen zusätzlichen Funktionen für die Anzeige des „Tiefen“-Kanals und der jeweiligen Ausbrüche umgeschrieben. Es ermöglicht auch, frühere Zickzackpunkte zu beobachten. Optional kann es den Benutzer benachrichtigen, wenn Ausbrüche auftreten. Die Benachrichtigungen können einfach auf dem Terminal oder auch per Push-Benachricht
Auswahl:
Keine Bewertungen
Antwort auf eine Rezension