Patternist
- Indikatoren
- Ziya Gurkan Badem
- Version: 2.0
- Aktualisiert: 27 November 2022
- Aktivierungen: 5
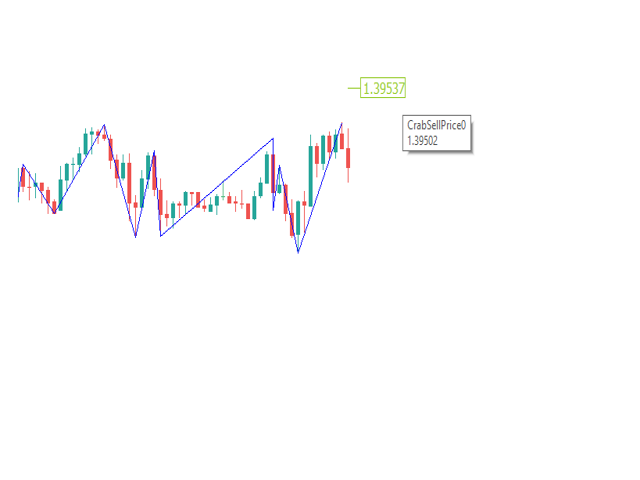
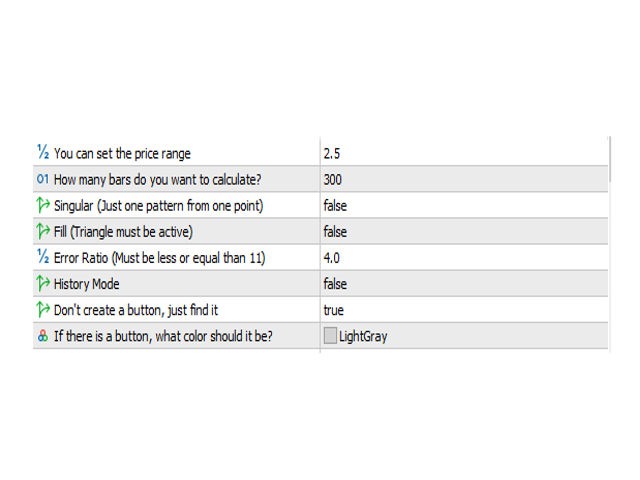
* Korrigierter und beschleunigter Zickzack. (Sie können den Bereich ändern)
* Der Zickzack wird mit jeder neuen Kerze/Bar aktualisiert.
* Wenn Sie möchten, indem Sie die Schaltfläche aktivieren, wird erst beim Klicken auf die Schaltfläche nach einem Muster gesucht. Wenn Sie dies automatisch tun, wird jedes Mal gesucht, wenn das Diagramm aktualisiert wird.
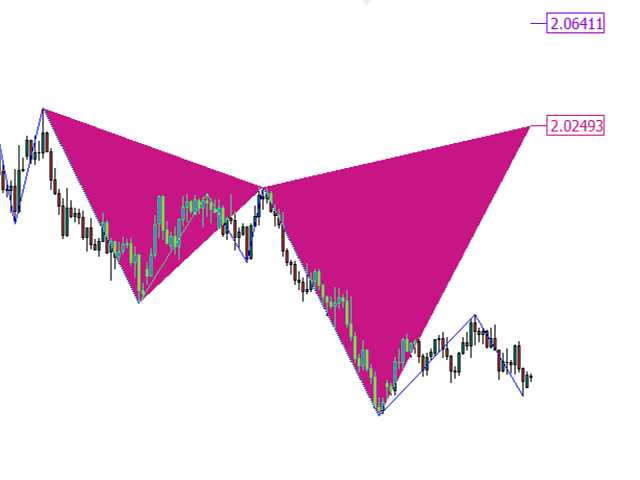
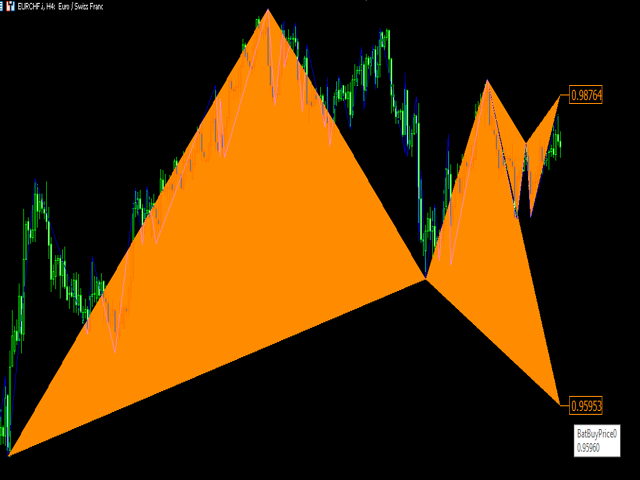
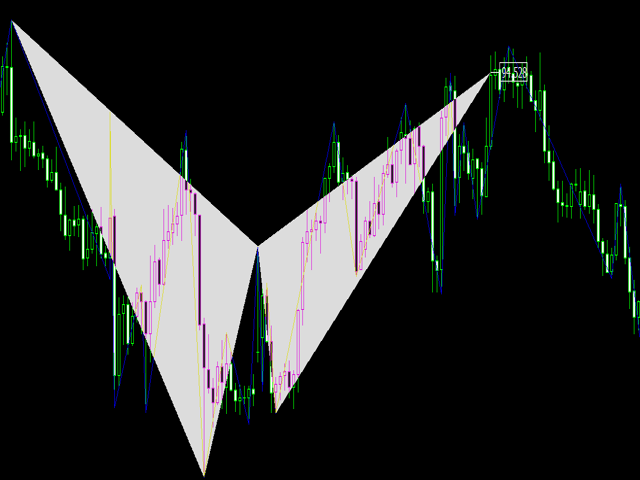
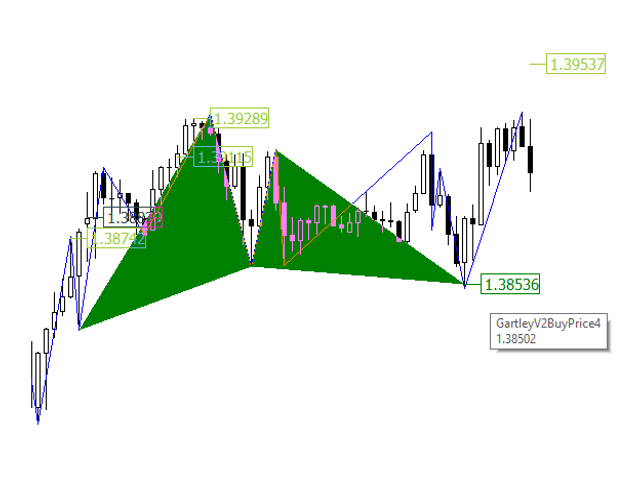
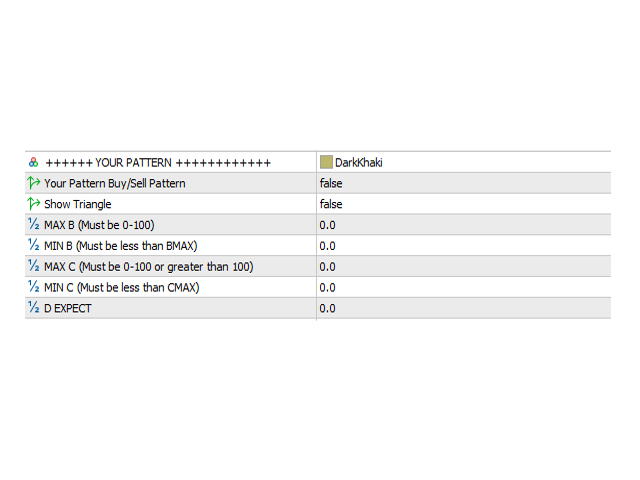
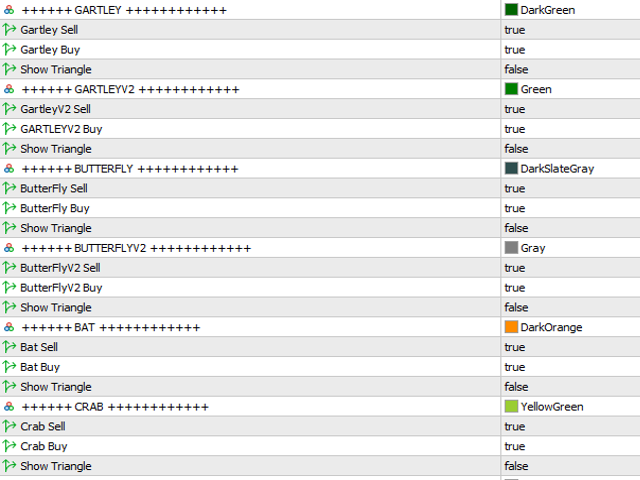
* 17 häufig verwendete harmonische Muster und ein spezielles Muster, mit dem Sie Ihre eigenen Proportionen definieren können.
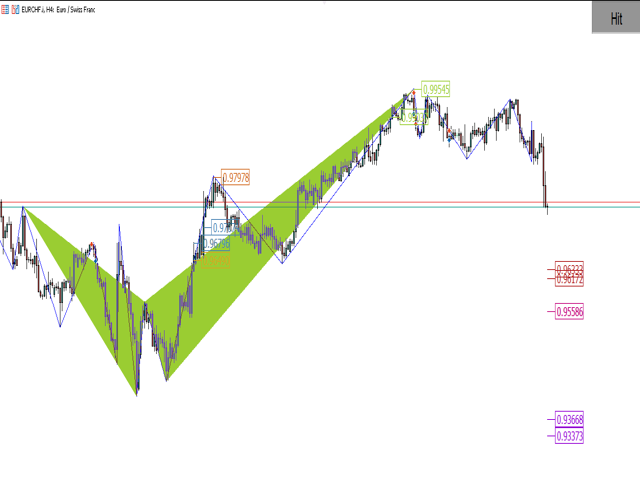
* Mit der Preisanzeige können Sie den Chart einfach halten. Sie können eine Dreiecksdarstellung erstellen, wenn Sie möchten.
* Sie können vergangene Auftritte mit dem "Verlaufsmodus" überprüfen.
* Nicht neu streichen.
* Wenn die Musterregeln nicht gültig sind, wird das Muster gelöscht. Wenn der Preis das angegebene Niveau erreicht, ist es möglich zu kaufen/verkaufen.
* Hinweis: Sie können alle anderen Muster auf "falsch" setzen und Ihre eigenen Proportionen festlegen. Sie können Ihr eigenes Muster im Verlaufsmodus testen. Wenn Sie mit dem Ergebnis zufrieden sind, können Sie es als Vorlage speichern.
* Muster:
* Kundenspezifisches Muster (Ihre speziellen Verhältnisse)
*Gartley
* GarleyV2
* Schmetterling
* Schmetterling V2
* Schläger
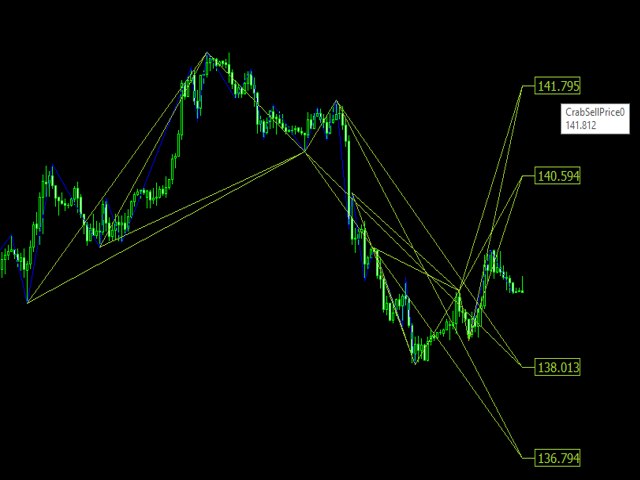
* Krabbe
* Tiefe Krabbe
* Chiffre
* Hai
* NenStar
* Anti-Schmetterling
* Anti-Fledermaus
* Anti-Krabbe
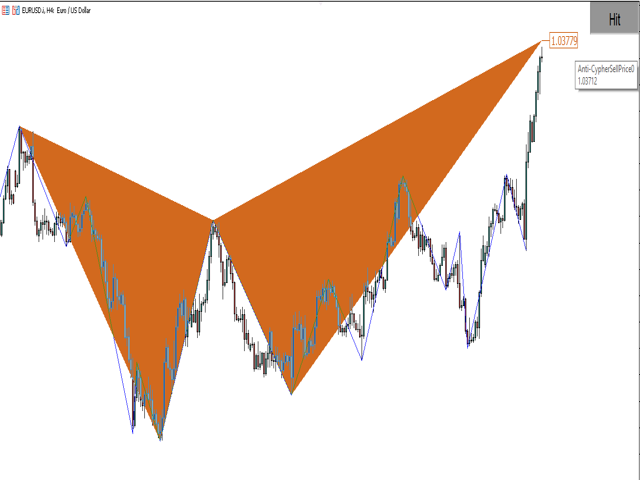
* Anti-Cypher
* Anti-Gartley
* Anti-AShark
* Anti-NenStar