RSI Dashboard Scanner
- Indikatoren
- Teddy Mutugi Mworia Teddy Mutugi Mworia
- Version: 2.0
- Aktualisiert: 9 August 2022
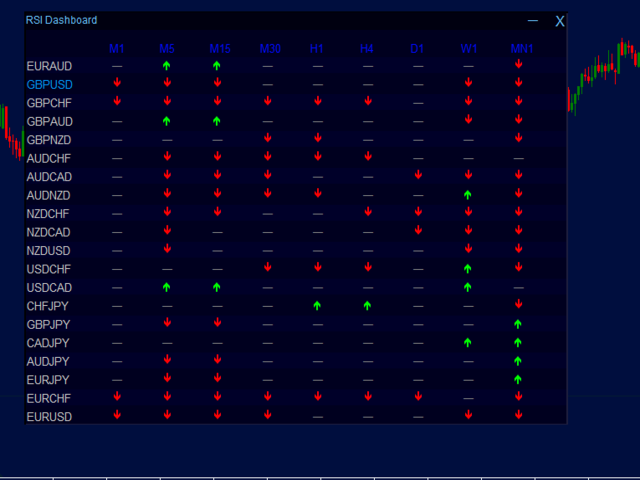
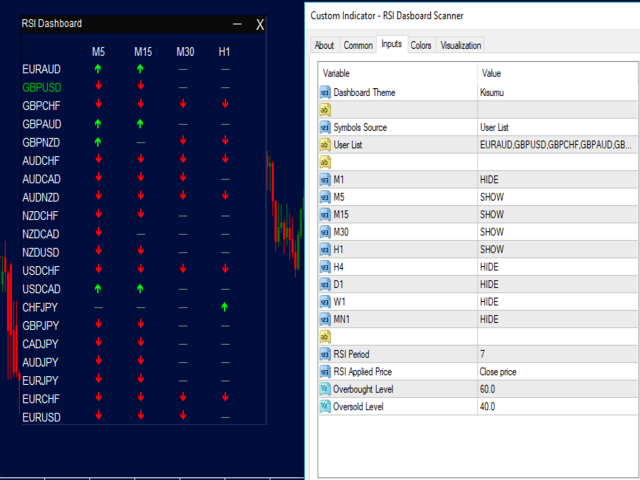
Dieser Indikator scannt mehrere Paare in mehreren Zeitrahmen nach RSI-Werten und zeichnet in Echtzeit grüne Aufwärtspfeile für überkaufte RSI-Werte und rote Abwärtspfeile für überverkaufte RSI-Werte.
Merkmale
•Animiertes Zeilenplotten
•Der Größe veränderbar
•Repositionierbar
•Minimierbar
•Mehrere Dashboard-Designs
•Mehrere Zeitrahmen
•Sie können ein Paar öffnen, indem Sie darauf klicken
•Aktuelles Diagrammpaar durch eine andere Farbe gekennzeichnet
•Verwenden Sie Marktbeobachtungspaare oder Ihre eigene Liste von Paaren
•Wählen Sie die Zeitrahmen aus, die angezeigt werden sollen


Completely admirable! Good stuff, my respect to you!