Investment Castle Support and Resistance MT4
- Indikatoren
- Ahmed Alaaeldin Abdulrahman Ahmed Elherzawi
- Version: 1.4
- Aktualisiert: 7 August 2021
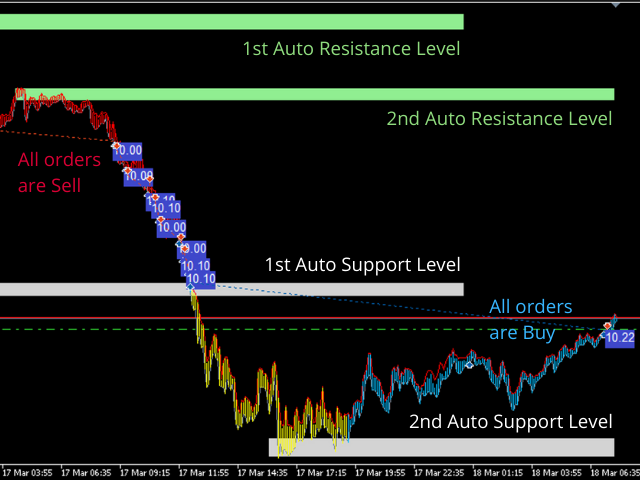
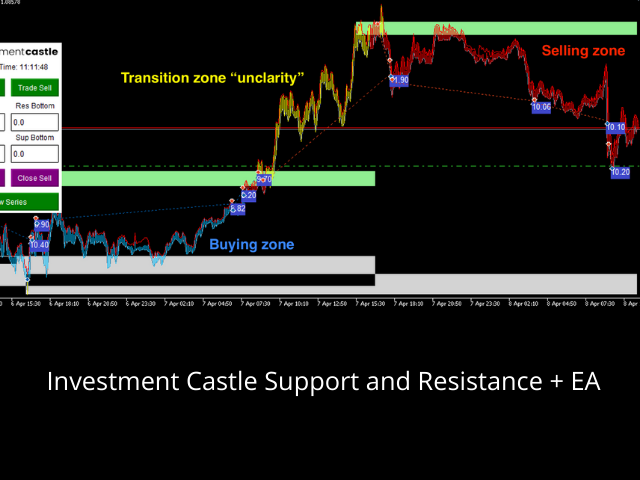
Investment Castle Support and Resistance Indicator has the following features:
1. Dictates the direction of Buy or Sell trades based on Support and Resistance Levels automatically.
2. Candles stick colors will change to Red for Sell and Blue for Buy (Default settings, user can change from the inputs).
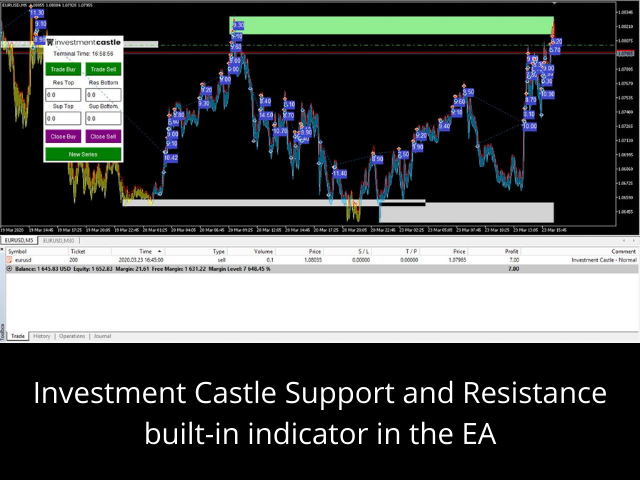
3. This indicator is built-in the Support & Resistance based Investment Castle EA which works with Psychological Key Levels "Support & Resistance".


Perfect work again !!! Big thanks