• Übersicht
  • Bewertungen (2)
  • Diskussion (8)
  • Neue Funktionen

Technical Dashboard

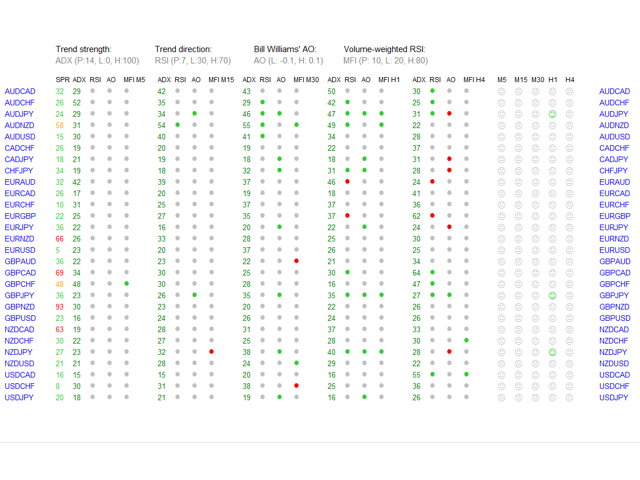
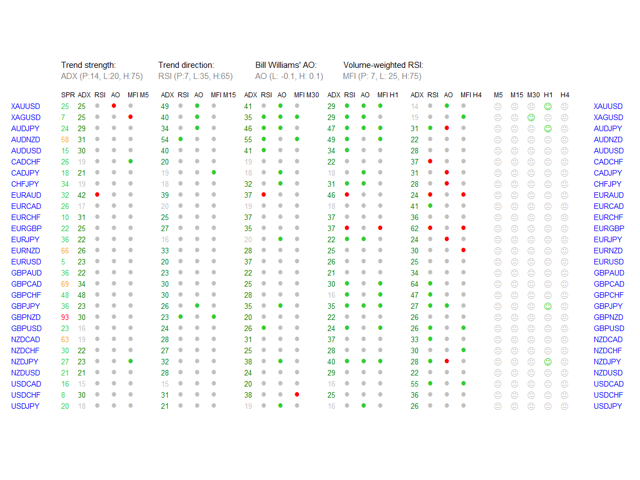
Technical Dashboard is a great tool for quickest possible analysis of multiple currency pairs in terms of coherent conditions of 4 different indicators at the same time.

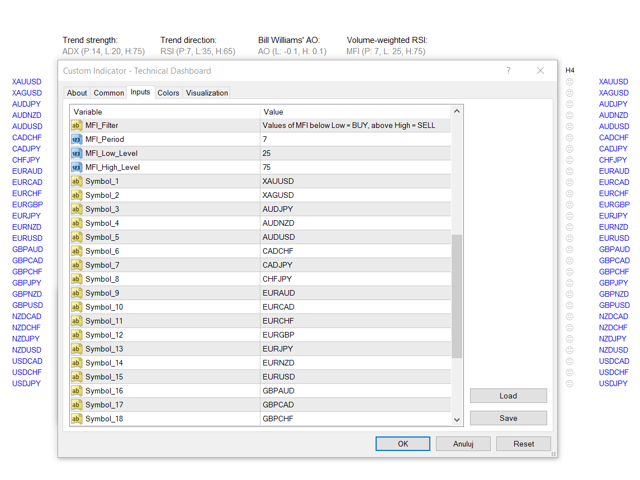
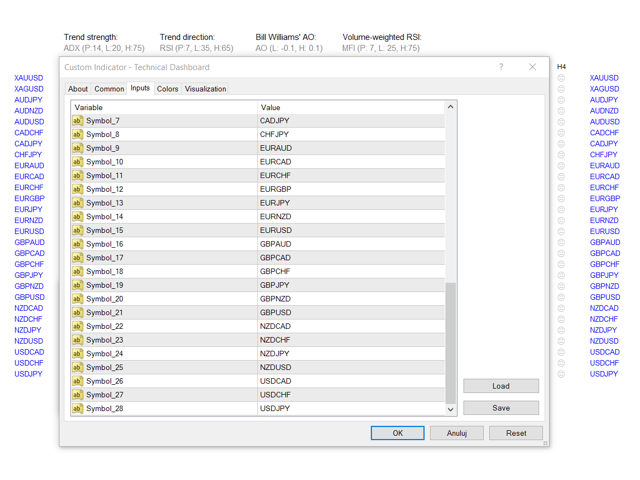
The number of displayed symbols is 30 and the name of each symbol can be edited in the parameters, so we are able to analyze not only predetermined currency pairs, but also other ones, commodities, equities, indices, currency pairs with prefixes and suffixes etc.

This analyzer is perfect for alert notifications through the MetaTrader terminal, push notifications to mobile device and also email alerts, e.g. from a VPS. We can disable/enable each one (alerts, notifications, e-mails).

Technical Dashboard is based on 4 technical indicators:

  1. Average Directional Movement Index which indicates strength of the trend.
  2. Relative Strength Index which indicates direction of the trend.
  3. Bill Williams' Awesome Oscillator which shows the market momentum.
  4. Money Flow Index (called also: volume-weighted Relative Strength Index) which indicates buying and selling pressure based on price and volume.

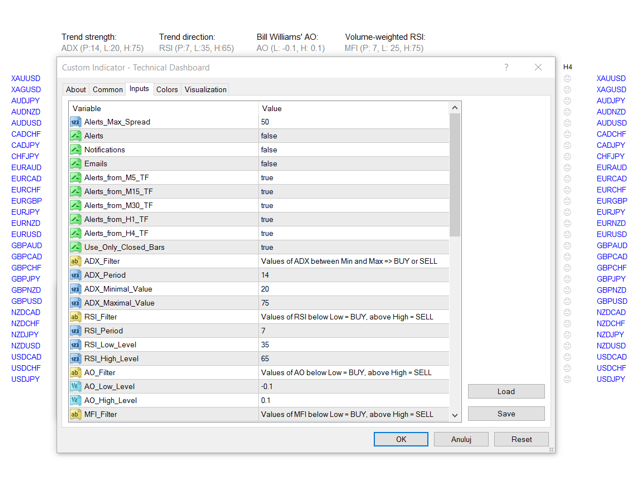
For each indicator we can set Low and High Level (for ADX it's Maximal and Minimal Value). For ADX, RSI and MFI we can set also Period. Conditions to trigger alerts can be met only if value of ADX is between ADX Minimal Value and ADX Maximal Value, value of RSI is lower than RSI Low Level (for BUY) or higher than RSI High Level (for SELL), value of AO is below AO Low Level (for BUY) or above AO High Level (for SELL), and value of MFI is lower than MFI Low Level (for BUY) or higher than MFI High Level (for SELL).

We get alert/notification/email only if all 4 conditions are met for a given currency pair in a given period of time and are coherent, so:

  1. ADX must be between Minimal and Maximal Value.
  2. RSI, AO and MFI must be above High Level for signal to SELL or below Low Level for signal to BUY.

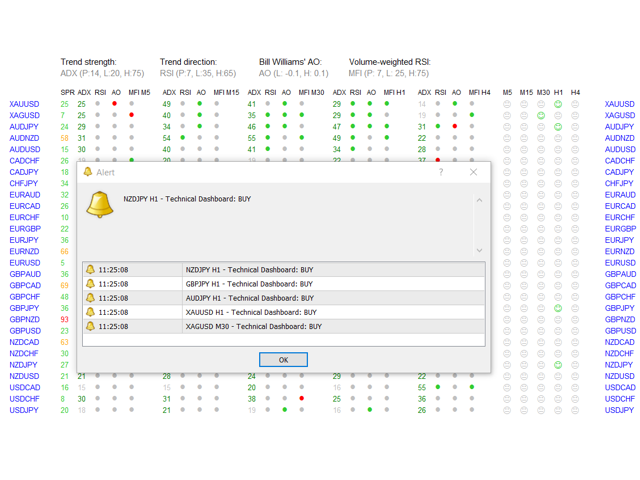
Green and red dots on dashboard indicate if condition is met for specified indicator, currency pair and timeframe. Green dots show Oversold (BUY), red - Overbought (SELL). If ADX is between Minimal and Maximal Value (value in green color - otherwise is gray) and 3 dots (for 3 indicators) are green or red for specified currency pair and timeframe - we will see green or red smiley on the right side of the dashboard. This means that all indicators are coherent.

Another parameter is "Use_Only_Closed_Bars" - if is set to "True" alerts come only from closed candles. If is set to "False" - alerts come immediately from current values of current candles.

Dashboard gives us possibility to choose 5 timeframes from which we will get alerts: M5, M15, M30, H1, H4.

In header of the dashboard are displayed all parameters of 4 indicators.

We can set maximum spread at which the notifications will come ("Alerts_Max_Spread").

Visible spread values on the dashboard have different colors:

  • a) when value is lower or equal to "Alerts_Max_Spread" - Green,
  • b) between 1 and 1.5 times higher than this parameter - Orange,
  • c) above 1.5 times higher than this parameter - Red.

I suggest to make a new template only with "Technical Dashboard" and scheme without colors ("None"), only Background and Foreground set to "White".

Remember, no one except yourself is responsible for any investment decision made by you.

You are responsible for your own investment research and investment decisions.

Good luck!
Empfohlene Produkte
Custom Logic For Trading
Jetaroon Sriboonruang
Overview Custom Logic for Trading is a sophisticated automated trading script designed to execute trades based on custom indicator signals, with robust position management features such as trailing stops, break-even settings, and filters. This script allows traders to implement their strategies with high precision and flexibility, enhancing their trading efficiency and profitability. Input Parameters Indicator Settings indicator_name : Name of the custom indicator to be used for generating signa
Awesome Oscillator by Bill Williams with the ability to fine-tune and replace the averaging algorithms of the indicator, which significantly expands the possibilities of using this oscillator in algorithmic trading and brings it closer in its properties to such an indicator as the MACD. To reduce price noise, the final indicator is processed with an additional Smooth averaging. The indicator has the ability to give alerts, send mail messages and push signals when the direction of movement of th
We present you the indicator "Candle closing counter", which will become your indispensable assistant in the world of trading. That’s why knowing when the candle will close can help: If you like to trade using candle patterns, you will know when the candle will be closed. This indicator will allow you to check if a known pattern has formed and if there is a possibility of trading. The indicator will help you to prepare for market opening and market closure. You can set a timer to create a p
VR Cub
Vladimir Pastushak
VR Cub ist ein Indikator für den Erhalt hochwertiger Einstiegspunkte. Der Indikator wurde entwickelt, um mathematische Berechnungen zu erleichtern und die Suche nach Einstiegspunkten in eine Position zu vereinfachen. Die Handelsstrategie, für die der Indikator geschrieben wurde, hat sich seit vielen Jahren bewährt. Ihr großer Vorteil liegt in der Einfachheit der Handelsstrategie, die es auch unerfahrenen Händlern ermöglicht, erfolgreich damit zu handeln. VR Cub berechnet Positionseröffnungspunkt
Diamond Trend
Segundo Calvo Munoz
Indicator which identifies Trend and also buy/sell opportunities. Use for entries aligned to the Trend.  Although Diamond Trend is very accurate identifying entry points, it is always recommended to use a support indicator in order to reconfirm the operation. Remind to look for those Assets and Timeframes which best fit to your trader behavior/need... Valid for Scalping and Long Term operations. Please, set up a Bars Chart to be able to visualize the indicator properly...  ...And remind to give
Strong Retracement Points Pro demo edition! SRP (Strong Retracement/Reversal Points) is a powerful and unique support and resistance indicator. It displays the closest important levels which we expect the price retracement/reversal! If all level are broken from one side, it recalculates and draws new support and resistance levels, so the levels might be valid for several days depending on the market! If you are still hesitating to start using this wonderful tool, you can check this link to see h
Trend Ray
Andriy Sydoruk
The indicator shows the potential trend direction by cyclical-wave dependence. Thus, all the rays of the intersection will be optimal rays, in the direction of which the price is expected to move, taking into account the indicator period. Rays can be used as a direction for potential market movement. But we must not forget that the approach must be comprehensive, the indicator signals require additional information to enter the market.
Super Reversal Pattern
Parfait Mujinga Ndalika
Super Reversal Pattern Indicator Unlock the power of advanced pattern recognition with our Super Reversal Pattern Indicator. Designed for traders seeking precision and reliability, this indicator identifies one of the most effective reversal patterns in technical analysis, offering a significant edge in your trading strategy. Key Features: Non-Repainting Accuracy: Enjoy the confidence of non-repainting technology. Once a Super Reversal Pattern is detected, it remains static, providing consis
Noize Absorption Index MT4
Ekaterina Saltykova
5 (1)
Noize Absorption Index - is the manual trading system that measures the difference of pressure between bears forces and bulls forces. Green line - is a noize free index that showing curent situation. Zero value of index shows totally choppy/flat market.Values above zero level shows how powerfull bullish wave is and values below zero measures bearish forces.Up arrow appears on bearish market when it's ready to reverse, dn arrow appears on weak bullish market, as a result of reverse expectation. S
Chart Patterns Detect 15 patterns (Ascending Triangle, Descending Triangle, Rising Wedge, Falling Wedge, Bullish Flag, Bearish Flag, Bullish Rectangle, Bearish Rectangle Symmetrical triangle, Head and Shoulders, Inverted Head and Shoulders, Triple top, Triple Bottom, Double Top, Double Bottom) Use historical data to calculate the probability of each pattern to succeed (possibility to filter notification according to the chance of success) gives graphic indication about the invalidation level and
Unser Basic Support and Resistance Indikator ist die Lösung, die Sie für die Steigerung Ihrer technischen Analyse benötigen.Mit diesem Indikator können Sie Support- und Widerstandsebenen in der Tabelle projizieren/ MT5 -Version Funktionen Integration von Fibonacci -Ebenen: Mit der Option, Fibonacci -Werte neben Unterstützung und Widerstandsniveau anzuzeigen, gibt unser Indikator einen noch tieferen Einblick in das Marktverhalten und mögliche Umkehrbereiche. Leistungsoptimierung: Mit der Op
The Th3Eng PipFinite indicator is based on a very excellent analysis of the right trend direction with perfect custom algorithms. It show the true direction and the best point to start trading. With StopLoss point and Three Take Profit points. Also it show the right pivot of the price and small points to order to replace the dynamic support and resistance channel, Which surrounds the price. And Finally it draws a very helpful Box on the left side on the chart includes (take profits and Stop loss
Trendiness Index
Libertas LLC
5 (3)
"The trend is your friend" is one of the best known sayings in investing, because capturing large trendy price movements can be extremely profitable. However, trading with the trend is often easier said than done, because many indicators are based on price reversals not trends. These aren't very effective at identifying trendy periods, or predicting whether trends will continue. We developed the Trendiness Index to help address this problem by indicating the strength and direction of price trend
Owl smart levels
Sergey Ermolov
4.34 (35)
MT5-Version  |  FAQ Der   Owl Smart Levels Indikator   ist ein komplettes Handelssystem innerhalb eines Indikators, der so beliebte Marktanalysetools wie die   fortschrittlichen Fraktale von Bill Williams , Valable ZigZag, das die   richtige Wellenstruktur   des Marktes aufbaut, und   Fibonacci-Levels , die die genauen Einstiegslevels markieren, enthält in den Markt und Orte, um Gewinne mitzunehmen. Detaillierte Strategiebeschreibung Anleitung zur Verwendung des Indikators Berater-Assistent im
Description: Please tick "Show object descriptions" in chart properties to enable hrays views That utility converts a trendline into a horizontal ray known as tool for drawing supply and demand zones. Simply create a trendline on a chart and once selected, it will get converted. Ray remains horizontal while dragging.  Quick ray plot: press "R" key to create horizontal ray. It will be snapped to the nearest OHLC value Further versions will be improved. For feature request please post new c
Program Overview: This program is a trading tool designed to monitor and analyze the 7 major currency pairs. It is a variant of a similar program used for tracking stock indices, but this version focuses on the seven major currency pairs. The program helps in identifying and calculating significant price movements (gaps) between the high and low prices of these currency pairs over a specified time frame. It then provides insights through comments and alerts based on the calculated gaps. Major Cu
The Penta-O is a 6-point retracement harmonacci pattern which usually precedes big market movements. Penta-O patterns can expand and repaint quite a bit. To make things easier this indicator implements a twist: it waits for a donchian breakout in the right direction before signaling the trade. The end result is an otherwise repainting indicator with a very reliable trading signal. The donchian breakout period is entered as an input. [ Installation Guide | Update Guide | Troubleshooting | FAQ | A
Daily Candle Predictor ist ein Indikator, der den Schlusskurs einer Kerze vorhersagt. Der Indikator ist in erster Linie für die Verwendung in D1-Charts gedacht. Dieser Indikator eignet sich sowohl für den traditionellen Devisenhandel als auch für den Handel mit binären Optionen. Der Indikator kann als eigenständiges Handelssystem oder als Ergänzung zu Ihrem bestehenden Handelssystem verwendet werden. Dieser Indikator analysiert die aktuelle Kerze und berechnet bestimmte Stärkefaktoren innerhalb
Delta Pairs
Anatolii Zainchkovskii
Delta Pairs is an indicator for pair trading, it displays the divergence of two currency pairs. Does not redraw. A useful tool for the analysis of the behavior of two currency pairs relative to each other. Purpose The Delta Pairs indicator is designed for determining the divergences in the movements of two currency pairs. This indicator is displayed as two line charts and the difference (delta) between these charts in the form of a histogram. The Delta Pairs indicator will be useful for those
Fibonacci-Erweiterung und Retracement-Analyse-Tool Fibonacci-Retracing- und Extended-Line-Tools für die MT4-Plattform, ideal für Trader, die die und den Golden Section-Handel nutzen Hauptmerkmale: 1. Sie können mehrere Sätze von Fibonacci-Retracements direkt zeichnen, und die Beziehung zwischen wichtigen Rückkehrpunkten ist auf einen Blick ersichtlich. 2. Kann Fibonacci-Erweiterungen zeichnen 3. Das Fibonacci-Foldback und die Verlängerung der Linie können nach links und nach rechts zu
This product is a part of  ON Trade Waves Patterns Harmonic Elliot Wolfe you can test free version on EURJPY from this link  Wolf Waves Indicator E ntdecken Sie Wolf Waves - Ihr ultimatives Handelswerkzeug! Sind Sie auf der Suche nach einem leistungsstarken Tool, um Wolf Waves auf jedem Zeitrahmen leicht zu erkennen? Suchen Sie nicht weiter! Unser Wolf Waves-Indikator erledigt diese Aufgabe mühelos. Hier erfahren Sie, warum er perfekt für Sie ist: Hauptmerkmale: Automatische Erkennung: Unser
TS krachobor
Magomed Zakaryaev
Всем привет! Выставляю свою торговую стратегию для форекс (далее - ТС). После покупки или аренды ТС пишете мне, я вас добавляют в закрытый чат телеграм, где дам все индикаторы и поддержку по торговле, и мы вместе будем торговать. Статистику по торговле в ТС я добавлю чуть позже, так как открыл новый счет по ТС, что бы было наглядно как проходит торговля. Кроме этого  я дам счет и пароль инвестора, можете сами смотреть в живую торговлю и решить для себя подходит ли она для вас. Два режима, 1) Сре
This is a new strategy for SUPPLY DEMAND areas It is based on a calculation using the tick volume to detect the big price action in market for both bear /bull actions this smart volume action candles are used to determine the supply and demand areas prices in between main supply and demand lines indicate sideway market  up arrows will be shown when prices moves above the main supply and the secondary supply lines Down arrows will be shown when prices moves below the main demand and the secondary
For sure, this indicator has become very popular amongst traders. Through coding this indicator will give you the most accurate levels possible for your trading analysis. We have also added in the ability for you to receive alerts when the price breaks above or below a Support or Resistance lines! HOW TO USE The red rectangles represent your resistance/supply zone. The green rectangles represent your support/demand zone.  BONUS FEATURES We coded this indicator with the ability to switch between
TWO PAIRS SQUARE HEDGE METER INDICATOR Try this brilliant 2 pairs square indicator It draws a square wave of the relation between your two inputs symbols when square wave indicates -1 then it is very great opportunity to SELL pair1 and BUY Pair2 when square wave indicates +1 then it is very great opportunity to BUY pair1 and SELL Pair2 the inputs are : 2 pairs of symbols         then index value : i use 20 for M30 charts ( you can try other values : 40/50 for M15 , : 30 for M30 , : 10 for H1 ,
Blahtech Market Profile
Blahtech Limited
4.56 (16)
Was: $249  Now: $99   Market Profile defines a number of day types that can help the trader to determine market behaviour. A key feature is the Value Area, representing the range of price action where 70% of trading took place. Understanding the Value Area can give traders valuable insight into market direction and establish the higher odds trade. It is an excellent addition to any system you may be using. Blahtech Limited presents their Market Profile indicator for the MetaTrader community. Ins
Dienstprogramm für automatisches Auftrags- und Risikomanagement. Ermöglicht es Ihnen, das Maximum aus den Gewinnen herauszuholen und Ihre Verluste zu begrenzen. Erstellt von einem praktizierenden Trader für Trader. Das Dienstprogramm ist einfach zu bedienen und funktioniert mit allen Marktaufträgen, die manuell von einem Händler oder mit Hilfe von Beratern eröffnet wurden. Kann Trades nach magischer Zahl filtern. Das Dienstprogramm kann mit einer beliebigen Anzahl von Aufträgen gleichzeitig arb
Cosmic Diviner X Planet
Olena Kondratenko
4 (2)
This unique multi-currency strategy simultaneously determines the strength of trends and market entry points, visualizing this using histograms on the chart. The indicator is optimally adapted for trading on the timeframes М5, М15, М30, Н1. For the convenience of users, the indicator renders the entry point (in the form of an arrow), recommended take profit levels (TP1, TP2 with text labels) and the recommended Stop Loss level. The take profit levels (TP1, TP2) are automatically calculated for
Volume by Price MT4
Brian Collard
4.64 (11)
The Volume by Price Indicator for MetaTrader 4 features Volume Profile and Market Profile TPO (Time Price Opportunity). Volume and TPO histogram bar and line charts. Volume Footprint charts. TPO letter and block marker collapsed and split structure charts. Static, dynamic and flexible range segmentation and compositing methods with relative and absolute visualizations. Session hours filtering and segment concatenation with Market Watch and custom user specifications. Graphical layering, positio
Atomic Analyst
Issam Kassas
5 (2)
Zunächst einmal ist es erwähnenswert, dass dieser Handelsindikator nicht neu malt, nicht neu zeichnet und keine Verzögerung aufweist, was ihn sowohl für manuellen als auch für Roboterhandel ideal macht. Benutzerhandbuch: Einstellungen, Eingaben und Strategie. Der Atom-Analyst ist ein PA-Preisaktionsindikator, der die Stärke und das Momentum des Preises nutzt, um einen besseren Vorteil auf dem Markt zu finden. Ausgestattet mit fortschrittlichen Filtern, die helfen, Rauschen und falsche Signale z
Käufer dieses Produkts erwarben auch
Trade Assistant MT4
Evgeniy Kravchenko
4.43 (180)
Sie hilft bei der Berechnung des Risikos pro Handel, der einfachen Einrichtung einer neuen Order, der Orderverwaltung mit Teilschließungsfunktionen, Trailing-Stop von 7 Typen und anderen nützlichen Funktionen. Achtung, die Anwendung funktioniert nicht im Strategietester. Manual, Description, Download demo Linienfunktion Zeigt auf dem Chart die Eröffnungslinie, Stop Loss, Take Profit. Mit dieser Funktion ist es einfach, eine neue Order einzurichten und ihre zusätzlichen Eigenschaften vor der
Local Trade Copier EA MT4
Juvenille Emperor Limited
5 (79)
Erleben Sie außergewöhnlich schnelles Trade Copying mit dem Local Trade Copier EA MT4 . Mit seiner einfachen 1-Minuten-Setup können Sie Trades zwischen mehreren MetaTrader-Terminals auf demselben Windows-Computer oder Windows VPS mit blitzschnellen Kopiergeschwindigkeiten von unter 0.5 Sekunden kopieren. Ob Anfänger oder professioneller Trader - der Local Trade Copier EA MT4 bietet eine Vielzahl von Optionen, um ihn an Ihre spezifischen Bedürfnisse anzupassen. Es ist die ultimative Lösung für
Forex Trade Manager MT4
InvestSoft
4.98 (372)
Denken Sie, dass in Märkten, in denen sich der Preis in Sekundenbruchteilen ändern kann, die Auftragserteilung so einfach wie möglich sein sollte? Wenn Sie im Metatrader eine Order eröffnen möchten, müssen Sie ein Fenster öffnen, in dem Sie den Eröffnungskurs, Stop-Loss und Take-Profit sowie die Größe der Transaktion eingeben müssen. Beim Handel an den Finanzmärkten ist die Verwaltung Ihres Kapitals unerlässlich, um Ihre Ersteinzahlung zu erhalten und zu vervielfachen. Wenn Sie also eine Order
The product will copy all telegram signal to MT4   ( which you are member  ) , also it can work as remote copier.  Easy to set up, copy order instant, can work with almost signal formats, image signal, s upport to translate other language to English Work with all type of channel or group, even channel have "Restrict Saving Content", work with  multi channel, multi MT5 Work as remote copier: with signal have ticket number, it will copy exactly via ticket number. Support to backtest signal. How to
Trade Dashboard MT4
Fatemeh Ameri
5 (34)
Tired of complex order placement and manual calculations? Trade Dashboard is your solution. With its user-friendly interface, placing orders becomes effortless, by a single click, you can open trades, set stop loss and take profit levels, manage trade lot size, and calculate risk to reward ratios, allowing you to only focus on your strategy. Say goodbye to manual calculations and streamline your trading experience with Trade Dashboard. Download  Demo Version  right now. You can find  Details
Grid Manual MT4
Alfiya Fazylova
4.72 (18)
Grid Manual ist ein Trading-Panel zum Arbeiten mit einem Raster von Orders. Das Dienstprogramm ist universell, verfügt über flexible Einstellungen und eine intuitive Benutzeroberfläche. Es arbeitet mit einem Raster von Aufträgen nicht nur in Richtung Verlust, sondern auch in Richtung steigender Gewinne. Der Händler muss kein Orderraster erstellen und pflegen, all dies wird von "Grid Manual" erledigt. Es genügt, eine Order zu eröffnen und das "Grid Manual" erstellt automatisch ein Orderraster daf
Mentfx Mmanage
Anton Jere Calmes
5 (15)
The added video will show you the full functionality, effectiveness, and simplicity of this trade manager. Drag and Drop Trade Manager. Draw your entry and have the tool calculate the rest. Advanced targeting and close portions of a trade directly available in tool (manage trades while you sleep). Market order or limit order on either side with factored spread. Just draw the entry, the tool does the rest. Hotkey setup to make it simple. Draw where you want to enter, and the stop loss, the tool c
Exp COPYLOT CLIENT for MT4
Vladislav Andruschenko
4.7 (61)
Handelskopierer für MetaTrader 4. Er kopiert Devisengeschäfte, Positionen und Bestellungen von beliebigen Konten. Es ist eines der besten Handelskopiergeräte  MT4 - MT4, MT5 - MT4 für die Version COPYLOT MT4  (oder MT4 - MT5 MT5 - MT5 für die Version COPYLOT MT5 ). MT5-Version Gesamte Beschreibung   +DEMO +PDF Wie kauft man Wie installiert man     So erhalten Sie Protokolldateien     So testen und optimieren Sie     Alle Produkte von Expforex Kopiererversion für das MetaTrader 5- Terminal
Der MT4 to Telegram Signal Provider ist ein benutzerfreundliches, vollständig anpassbares Tool, das das Senden von Handelssignalen an Telegram ermöglicht und Ihr Konto in einen Signalanbieter verwandelt. Das Format der Nachrichten ist vollständig anpassbar! Für eine einfache Nutzung können Sie jedoch auch eine vordefinierte Vorlage wählen und spezifische Teile der Nachricht aktivieren oder deaktivieren. [ Demo ]   [ Handbuch ] [ MT5-Version ] [ Discord-Version ] [ Telegram-Kanal ] Einrichtung
The News Filter
Leolouiski Gan
5 (20)
Dieses Produkt filtert alle Expert Advisors und manuelle Charts während der Nachrichtenzeit, sodass Sie sich keine Sorgen um plötzliche Preisschwankungen machen müssen, die Ihre manuellen Handels-Setups oder Trades, die von anderen Expert Advisors eingegeben wurden, zerstören könnten. Dieses Produkt wird auch mit einem vollständigen Order-Management-System geliefert, das Ihre offenen Positionen und ausstehenden Aufträge vor der Veröffentlichung von Nachrichten bearbeiten kann. Sobald Sie The New
Trade copier MT4
Alfiya Fazylova
4.52 (29)
Trade Copier ist ein professionelles Dienstprogramm zum Kopieren und Synchronisieren von Trades zwischen Handelskonten. Das Kopieren erfolgt vom Konto / Terminal des Lieferanten auf das Konto / Terminal des Empfängers, das auf demselben Computer oder vps installiert ist. Vor dem Kauf können Sie die Demoversion auf einem Demokonto testen. Demoversion hier . Vollständige Anweisungen hier . Hauptfunktionalität und Vorteile: Unterstützt das Kopieren von MT4> MT4, MT4> MT5, MT5> MT4, einschließlich M
TPSpro Trade PRO
Roman Podpora
5 (4)
IM TESTMODUS (im Tester) ist die Panel-Funktionalität NICHT AKTIV. Wir haben nur eine visuelle Darstellung des Panels selbst bereitgestellt. Ein Tool, das die Positionsgröße oder das Risiko basierend auf einem bestimmten Stop-Loss-Level sofort berechnen kann, ist sowohl für professionelle Händler als auch für Anfänger von entscheidender Bedeutung. Das Handelsdienstprogramm TRADE PRO bietet schnelle und genaue Berechnungen und hilft Ihnen, Entscheidungen unter Bedingungen begrenzter Zeit und er
Übernehmen Sie die Kontrolle über Ihr Forex-Portfolio. Sehen Sie sofort, wo Sie stehen, was funktioniert und was Ihnen Schmerzen bereitet! MT5-VERSION HIER VERFÜGBAR: https://www.mql5.com/en/market/product/58658 Das Trade Manager Dashboard soll Ihnen auf einen Blick zeigen, wo sich jede Ihrer Positionen auf dem Devisenmarkt derzeit befindet, und das Risikomanagement und das Engagement in Währungen verständlicher machen. Für Händler, die schrittweise mit mehreren Positionen oder diesen Trading
TradePanel MT4
Alfiya Fazylova
4.91 (85)
Trade Panel ist ein multifunktionaler Handelsassistent. Die Anwendung enthält mehr als 50 Funktionen für den manuellen Handel und ermöglicht Ihnen die Automatisierung der meisten Handelsaktionen. Vor dem Kauf können Sie die Demoversion auf einem Demokonto testen. Demo hier . Vollständige Anweisungen hier . Handel. Ermöglicht Ihnen die Durchführung grundlegender Handelsvorgänge mit einem Klick: Ausstehende Aufträge und Positionen öffnen. Offenes Raster von Aufträgen. Schließen ausstehender Aufträ
Kopieren Sie Signale von jedem Kanal, dem Sie angehören (einschließlich privater und eingeschränkter Kanäle) direkt auf Ihren MT4.  Dieses Tool wurde mit dem Benutzer im Hinterkopf entwickelt und bietet viele Funktionen, die Sie benötigen, um die Trades zu verwalten und zu überwachen. Dieses Produkt wird in einer benutzerfreundlichen und visuell ansprechenden grafischen Benutzeroberfläche präsentiert. Passen Sie Ihre Einstellungen an und starten Sie die Nutzung des Produkts innerhalb weniger Mi
50% off. Original price: $375 Reward Multiplier is a semi-automatic trade manager based on pyramid trading that opens additional orders with the running profit of your trades to maximize return exponentially without increasing the risk. Unlike other similar EAs, this tool shows potential profit/loss and reward to risk ratio before even entering the first trade! Download Demo here  (starting lot is fixed at 0.01) Guide + tips here MT5 version   here You only open the first order. When your
DrawDown Limiter MT4
Haidar, Lionel Haj Ali
5 (8)
Drawdown Limiter EA You are in the right place if you were searching for Drawdown control, Drawdown limiter, Balance protection, Equity Protection or Daily Drawdown Limit related to Prop Firm, FTMO, or Funded account trading, or if you want to protect your trading account. Have you suffered from controlling your drawdown when trading funded accounts? This EA is meant for you. Prop firms usually set a rule called “Trader Daily Drawdown”, and if it is not respected, you are disqualified.  I am an
VirtualTradePad mt4 Extra
Vladislav Andruschenko
4.88 (57)
Trading Panel für den Handel mit 1 Klick.  Arbeiten mit Positionen und Aufträgen!  Handeln vom Chart oder von der Tastatur. Mit unserem Trading-Panel können Sie mit einem Klick vom Chart aus handeln und Handelsoperationen 30-mal schneller ausführen als die Standard-MetaTrader-Steuerung. Automatische Berechnungen von Parametern und Funktionen, die einem Händler das Leben erleichtern und einem Händler helfen, seine Handelsaktivitäten viel schneller und bequemer durchzuführen. Grafische Tipps und
Summer 50% discount ($199 -> $99) Advanced trading tool: One click smart orders that execute under your conditions Developed by trader for trading community:  position size calculator (lot size), open position after price action, strategy builder, set and forget trading, mobile notifications... Risk Management -  Risk percentage position size calculator, gain percentage, target risk reward ratio, spread and commissions are included in calculations 7 Advanced order types   - Set and forget tra
The program is use to copy trading from MT4   to MT4 and MT5  on local PC or copy  over the Internet.   Now you can easy copy trades to any where or share to friends. Only run one Flash Server on VPS, also need allow the apps if you turn on Windows Firewall. Can not add more than 20 account copier to server, include both  MT4 and MT5 Get free Copier EA for MT4 and MT5 (only  receive signal),   download here Instants copy, speed smaller 0.1 seconds, easy to setup How to setup and guide Let read a
BBMA Oma Ally Signals Scanner (BBMA Oma Ally Analyzer Dashboard EA) This is a multi-pair and multi scanner dashboard to find the key signal of BBMA Oma Ally Strategy BBMA consists of the use of 2 indicators: Moving Averages Bollinger Bands BBMA consists of many types of entries: Reentry Extreme Rejection EMA50 GAP (EMA50 to Upper/Lower BB) MHV Full Setup (CSE>TPW>MHV>Direction>Reentry) There are many multi timeframe signals based on this strategy. RRE (Reentry - Reentry - Extreme) REE (Reentry
Trade Assistant Pro 36 in 1
Makarii Gubaydullin
4.95 (19)
Multifunktionswerkzeug: 65+ Funktionen, einschließlich: Lot-Rechner, Price Action, Risiko/Gewinn-Verhältnis, Trade Manager, Angebot und Nachfrage Zonen Demo version   |   Anwenderhandbuch   |    MT5 Das Dienstprogramm funktioniert nicht im Strategietester: Sie können die   Demoversion HIER   herunterladen, um das Produkt zu testen. Bei Fragen kontaktieren Sie mich / Verbesserungsvorschläge / im Fall eines gefundenen Fehlers Vereinfachen, beschleunigen und automatisieren Sie Ihre Handelsprozes
Risk Manager for MT4
Sergey Batudayev
4.56 (9)
Expert Advisor Risk Manager für MT4 ist ein sehr wichtiges und meiner Meinung nach notwendiges Programm für jeden Trader. Mit diesem Expert Advisor können Sie das Risiko in Ihrem Handelskonto kontrollieren. Die Risiko- und Gewinnsteuerung kann sowohl monetär als auch prozentual erfolgen. Damit der Expert Advisor funktioniert, hängen Sie ihn einfach an das Währungspaardiagramm an und legen Sie die akzeptablen Risikowerte in der Einzahlungswährung oder in % des aktuellen Guthabens fest. PROMO
Manual Trade Panel EA MT4
Juvenille Emperor Limited
5 (4)
Manual Trade Panel EA MT4 ist das einfachste und am einfachsten zu bedienende Handelspanel, das Sie für MT4 finden können. Es hat alle Optionen und Funktionen in einer Oberfläche, ohne dass zusätzliche Fenster oder Paneele geöffnet werden müssen. Es ist ein Auftragsverwaltungs-, Risikorechner-, Teilschließungs- und Kontoschutz-Dienstprogramm, alles in einer äußerst benutzerfreundlichen Oberfläche! Durch die Verwendung des Manual Trade Panel EA MT4 können Sie um ein Vielfaches schneller und ge
Dieser Expert Advisor überwacht ständig das Eigenkapital Ihres Handelskontos, um kostspielige Inanspruchnahmen zu vermeiden und/oder die Handelsregeln einzuhalten. Wenn bestimmte Regeln verletzt werden, alarmiert der EA, schließt alle Trades und löscht in einigen Fällen alle ausstehenden Orders. Optional können auch alle Diagramme geschlossen werden, um alle im Konto tätigen EAs zu entfernen. Dieser EA ist besonders nützlich für Prop Trading Challenges, wie die FTMO Challenge oder PZ Challenge.
Summer 40% discount ($149 -> $88) Everything for chart Technical Analysis indicator mt4 in one tool Draw your supply demand zone with rectangle and support resistance with trendline and get alerts to mobile phone or email alert -  Risk reward indicator Video tutorials, manuals, DEMO download   here .  Find contacts on my   profile . 1.   Extended rectangles and trendlines Object will be extended to the right edge of the chart when price will draw new candles on chart. This is rectangle extend
Trade Manager, der Ihnen hilft, Geschäfte schnell ein- und auszusteigen und gleichzeitig Ihr Risiko automatisch zu berechnen. Einschließlich Funktionen, die Ihnen helfen, Over Trading, Revenge Trading und Emotional Trading zu verhindern. Trades können automatisch verwaltet werden und die Kontoleistungskennzahlen können in einem Diagramm visualisiert werden. Diese Funktionen machen dieses Panel ideal für alle manuellen Händler und tragen zur Verbesserung der MetaTrader 4-Plattform bei. Unterstütz
The product will copy all  Discord  signal   to MT4   ( which you are member  ) , also it can work as remote copier.  Easy to set up. Work with almost signal formats, support to translate other language to English Work with multi channel, multi MT4. Work with Image signal. Copy order instant, auto detect symbol. Work as remote copier: with signal have ticket number, it will copy exactly via ticket number. How to setup and guide: Let read all details about setup and download Discord To MetaTrade
Trade Sync MT4
Anna Kolchina
5 (1)
« Trade Sync » — Really fast copying and precise synchronization of trades. Simple installation and configuration of the application within 5 seconds allows you to copy trades between different MetaTrader terminals installed on one Windows PC or Windows VPS at maximum speed. «Trade Sync» contains a large number of options for customizing the application to your specific needs and allows you to cope with even complex user tasks. Separate use: Trade Sync MT4 - allows you to copy (Мt4 > Мt4), Trade
If you need an advisor on any arrow indicator signals - this utility will definitely help you.  You will be able, with the help of this utility to form an unlimited number of EAs on YOUR signals , with your set of settings, with your copyright and complete source code . You will be able to use the resulting EAs unlimitedly , including adding them to the Market and other resources. Generated Martingale EA with the help of this script - here Free simple version of the generation script to help yo
Weitere Produkte dieses Autors
MFI Pointer is an indicator based on Money Flow Index indicator that uses both price and volume to measure buying and selling pressure. Money Flow Index is also known as volume-weighted RSI . MFI Pointer simply draws arrows on chart window when value of Money Flow Index (from parameter MFI_Period) is below MFI_Level (green upward pointing arrow) or above 100-MFI_Level (red downward pointing arrow). Indicator works on all timeframes and all currency pairs, commodities, indices, stocks etc. MFI Po
Envelopes Grid
Dominik Mandok
5 (1)
It's a simple but useful tool for creating a grid based on Envelopes. Only 2 parameters can be set: 1) "Period" - the period of all visible Envelopes (i.e. 4) and 1 Moving Average (Envelopes axis), 2) "Deviations Distance" - the distance between Envelopes. Naturally, the colors of all 9 lines can be changed as desired. It works with everything that is available in your Market Watch. Good luck!
FREE
Interceptor - professional volume and price extremes indicator. Interceptor is a powerful indicator, which thanks to a combination of four different types of normalized indicators in one algorithm can correctly identify extremes of the price leading to retracements and reversals in the trend. Algorithm is based mainly on combination of Accumulation/Distribution , On Balance Volume , Money Flow Index and Relative Strength Index . The first parameter of Interceptor is Interceptor_Depth which defin
Volume Volatility Dashboard is a great tool for quickest possible analysis of multiple currency pairs in terms of extremely high and extremely low accumulation to distribution ratio in comparison to values from past. The number of displayed symbols is 30 and the name of each symbol can be edited in the parameters, so we are able to analyze not only predetermined currency pairs, but also other ones, commodities, equities, indices, currency pairs with prefixes and suffixes etc... This analyzer is
RSI Dashboard is a great tool for quickest possible analysis of multiple currency pairs  at the same time in terms of Oversold or Overbought . All displayed and used by indicator symbols are freely to choose and are specified using a space separated list in parameters you're able to analyze not only predetermined ones, but everything that your broker offers, also commodities, equities, indices, ones with prefixes, suffixes etc. There are 3 types of alerts: alert notifications in the MT4 term
It's a simple but useful tool for creating a grid based on Bollinger Bands . Only 2 parameters can be set: 1) "Period" - the period of all visible Bollinger Bands (i.e. 4) and 1 Moving Average (axis of all Bollinger Bands), 2) "Deviations Distance" - the distance between Bollinger Bands. Naturally, the colors of all 9 lines can be changed as desired. It works with everything that is available in your Market Watch. Good luck!
FREE
RSI Pointer
Dominik Mandok
RSI Pointer is an indicator which simply draws arrows on a chart window when the value of RSI (from parameter RSI_Period) is below RSI_Level (green upward pointing arrow) or above 100-RSI_Level (red downward pointing arrow). RSI Pointer works on all timeframes and all currency pairs, commodities, indices, stocks etc. RSI Pointer has only two parameters, RSI_Period and RSI_Level . For example, if you set RSI_Period=7 and RSI_Level=20, the indicator will draw arrows for values below 20 (oversold)
CCI Pointer
Dominik Mandok
CCI Pointer is an indicator which simply draws arrows on chart window when value of CCI (from parameter CCI_Period) is above CCI_Level (red downward pointing arrow) or below negative CCI_Level (green upward pointing arrow). CCI Pointer works on all timeframes and all currency pairs, commodities, indices, stocks etc. CCI Pointer has only two parameters, CCI_Period and CCI_Level . For example, if you set CCI_Period=25 and CCI_Level=200 indicator will draw arrows for values below -200 (oversold) an
ADX Pointer
Dominik Mandok
ADX Pointer is an indicator which is based on "Average Directional Index" and draws three numbers in chart window depending on the value of ADX. In ADX Pointer you can set "ADX_Period" which is of course period of Average Directional Index and you can also set 3 levels. When ADX value exceed first level ("ADX_Level1") in chart window appears number "1", when ADX exceed second level ("ADX_Level2") appears "2" and when ADX exceed third level ("ADX_Level3") appears "3". Simple. ADX Pointer works on
Spread Display is a simple but very helpful indicator allowing live monitoring of spread in chart window. Using this indicator, there's no need to distract attention never again, seeking current spread value somewhere else. From now on, everything is clear and at the height of your eyes, in chart window of selected currency pair. Indicator has many settings. We can choose any font we want and we can set 3 spread levels ( Spread_Level_1 , Spread_Level_2 and Spread_Level_3 ) between which will cha
Volume Volatility
Dominik Mandok
4 (2)
Volume Volatility is an indicator which analyzes currency pairs, indices, commodities etc. in terms of extremely high and extremely low accumulation to distribution ratio in comparison to values from past. The most important parameter is "Volume Volatility Factor" - this parameter, in big simplification, determines how far distance in the past is analyzed. The lower value of the parameter, the indicator analyzes less data from the past. I recommend you to set and test e.g. 3, 5, 15, 35, and 48 w
RSI Breakout Dashboard
Dominik Mandok
5 (3)
RSI Breakout Dashboard  is a tool for multiple currency pairs analysis at the same time in terms of  breakout  (return) from  Oversold  or  Overbought  Zone to  Neutral  Zone. All displayed and used by indicator symbols are free to choose  and are specified using a space separated list in parameters, so you're able to analyze not only predetermined ones, but everything that your broker offers, also commodities, equities, indices, ones with prefixes, suffixes etc. You can choose 3 types of al
MFI Breakout Dashboard is a tool for multiple currency pairs analysis at the same time in terms of breakout from Oversold or Overbought Zone . Money Flow Index (MFI) uses both price and volume to measure buying and selling pressure. MFI is also known as volume-weighted RSI (Relative Strength Index). The number of displayed symbols is 30 and the name of each symbol can be edited in the parameters. The analyzer is perfect for alert notifications, push notifications and email alerts. We can also se
MFI Extremes Dashboard is a great tool for quickest possible analysis of multiple currency pairs in terms of Oversold or Overbought at the same time. Money Flow Index (MFI) uses both price and volume to measure buying and selling pressure. MFI is also known as volume-weighted RSI (Relative Strength Index). The number of displayed symbols is 30 and the name of each symbol can be edited in the parameters, so we are able to analyze not only predetermined currency pairs, but also other ones, commodi
Closing Orders At Specified Time is a utility which helps you to close opened orders and delete pending orders at a specified time - especially when you cannot be online and do it by yourself at that time. You can schedule a specific time for closing orders, and additionally you can choose what type of orders should be closed (all, only opened or only pending), what symbols (all or you can enter names of three symbols) and with what Magic Number. You can also select to close only profitable or o
Auswahl:
Johan Michel Struijk
248
Johan Michel Struijk 2017.02.21 13:28 
 

Der Benutzer hat keinen Kommentar hinterlassen

Dmitrii Korolev
214
Dmitrii Korolev 2016.08.25 17:02 
 

Der Benutzer hat keinen Kommentar hinterlassen

Antwort auf eine Rezension
Version 1.1 2021.11.30
Compiled with the latest version of MT4 to ensure 100% compatibility.