• Übersicht
  • Bewertungen
  • Diskussion

Multi Level ATR and Moving Average Band Indicator

Überblick

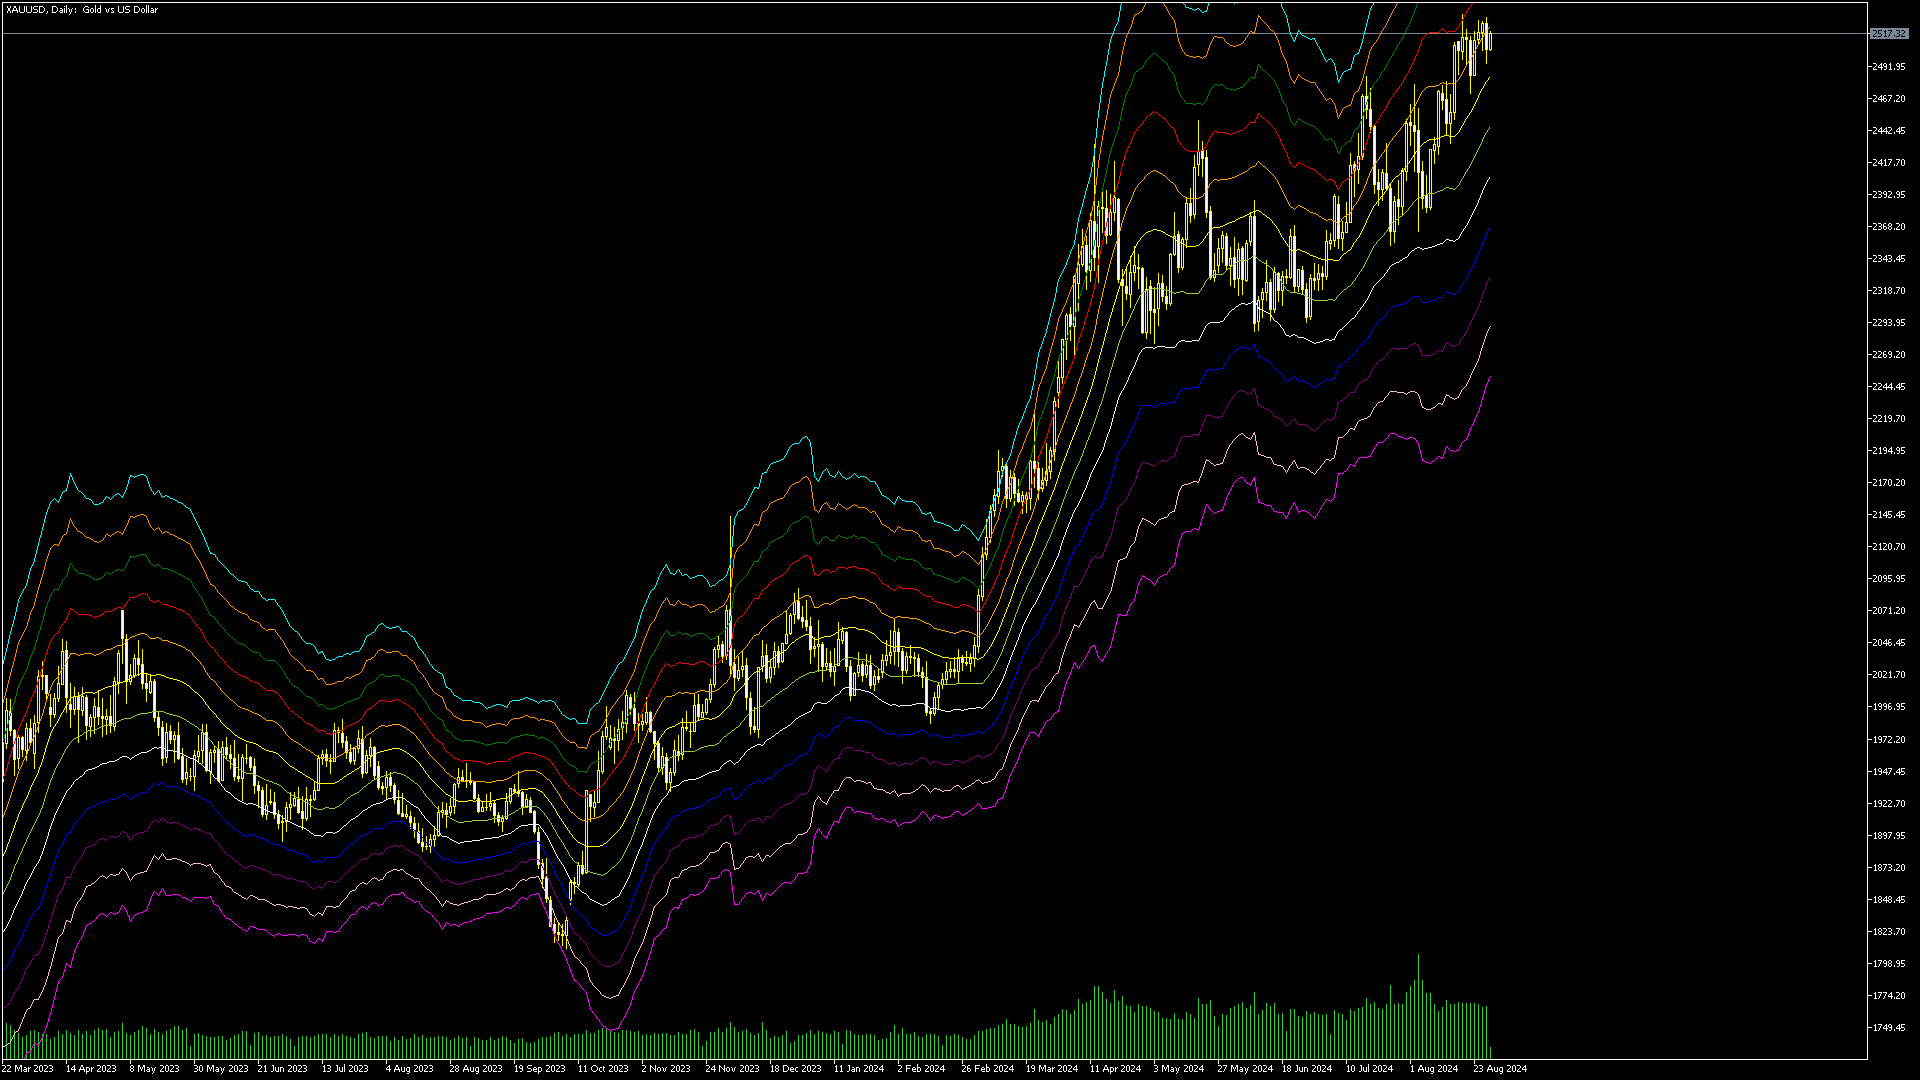
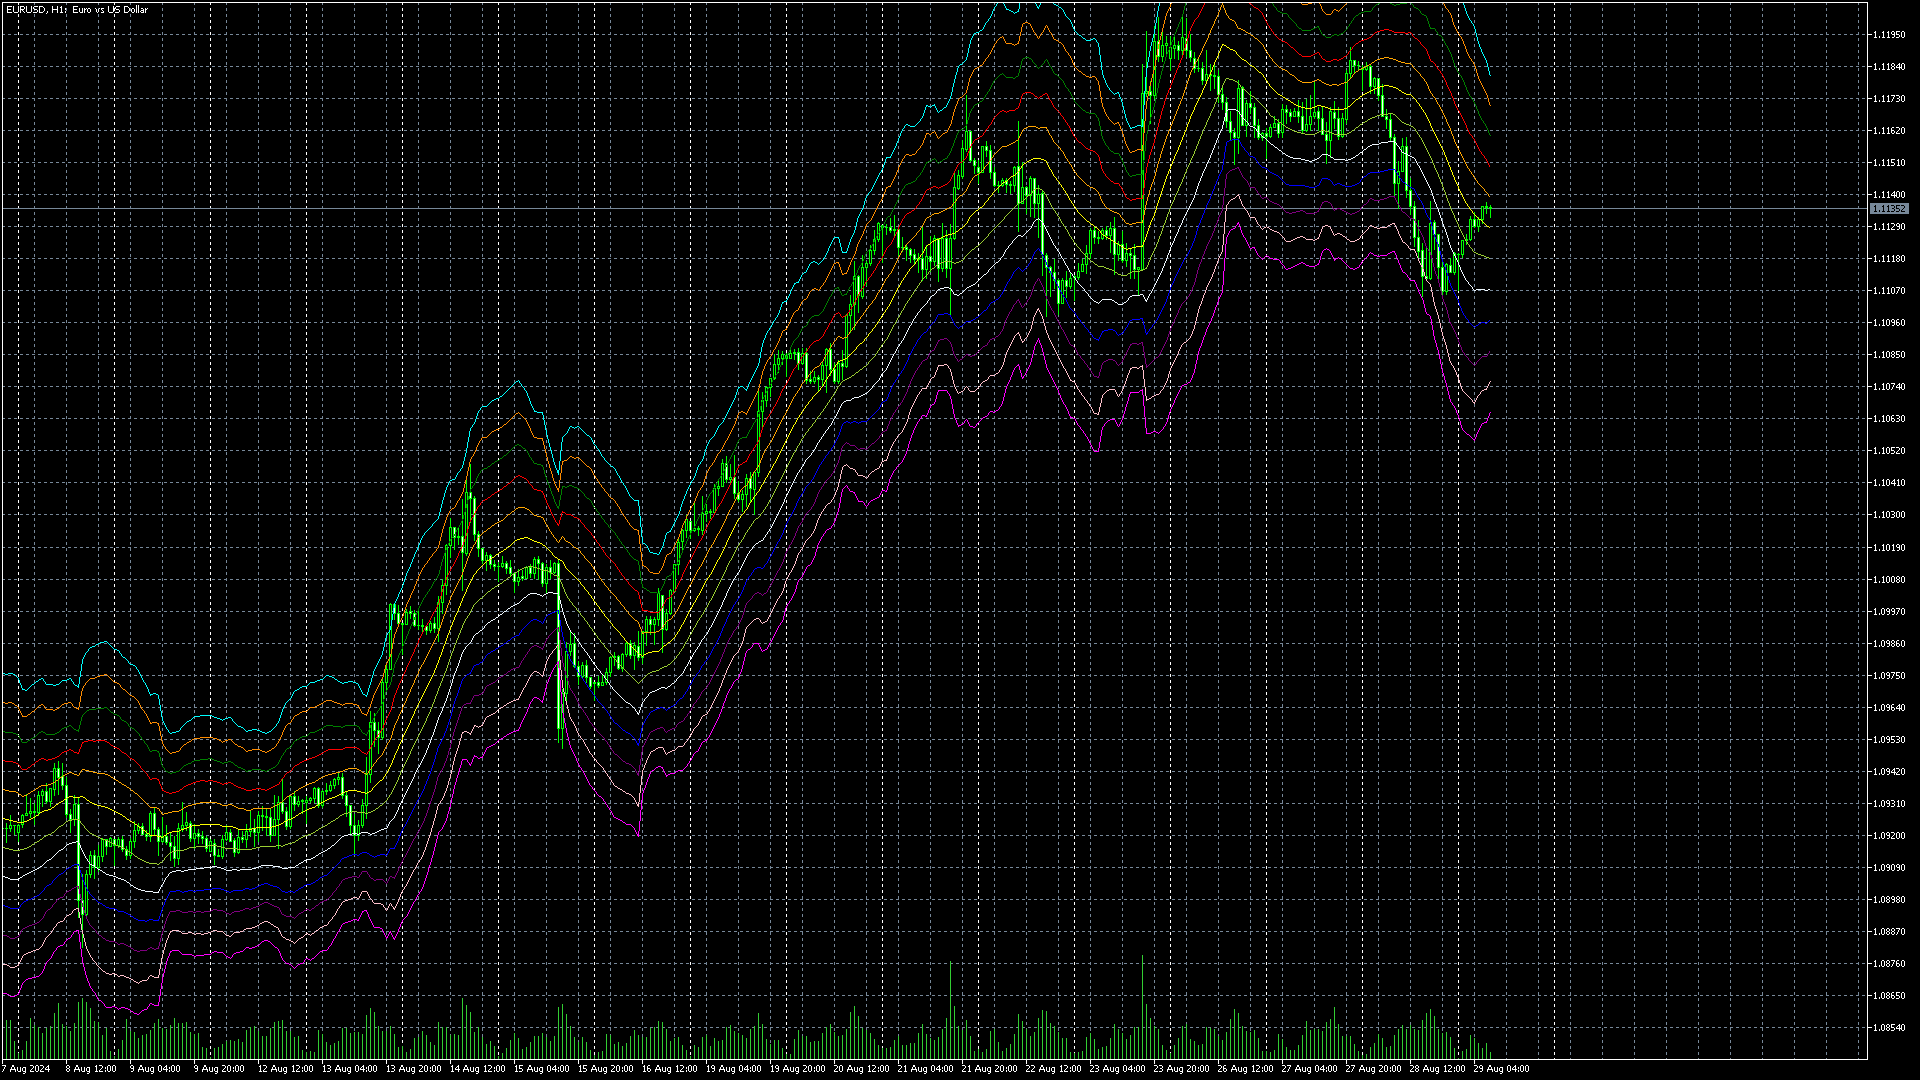
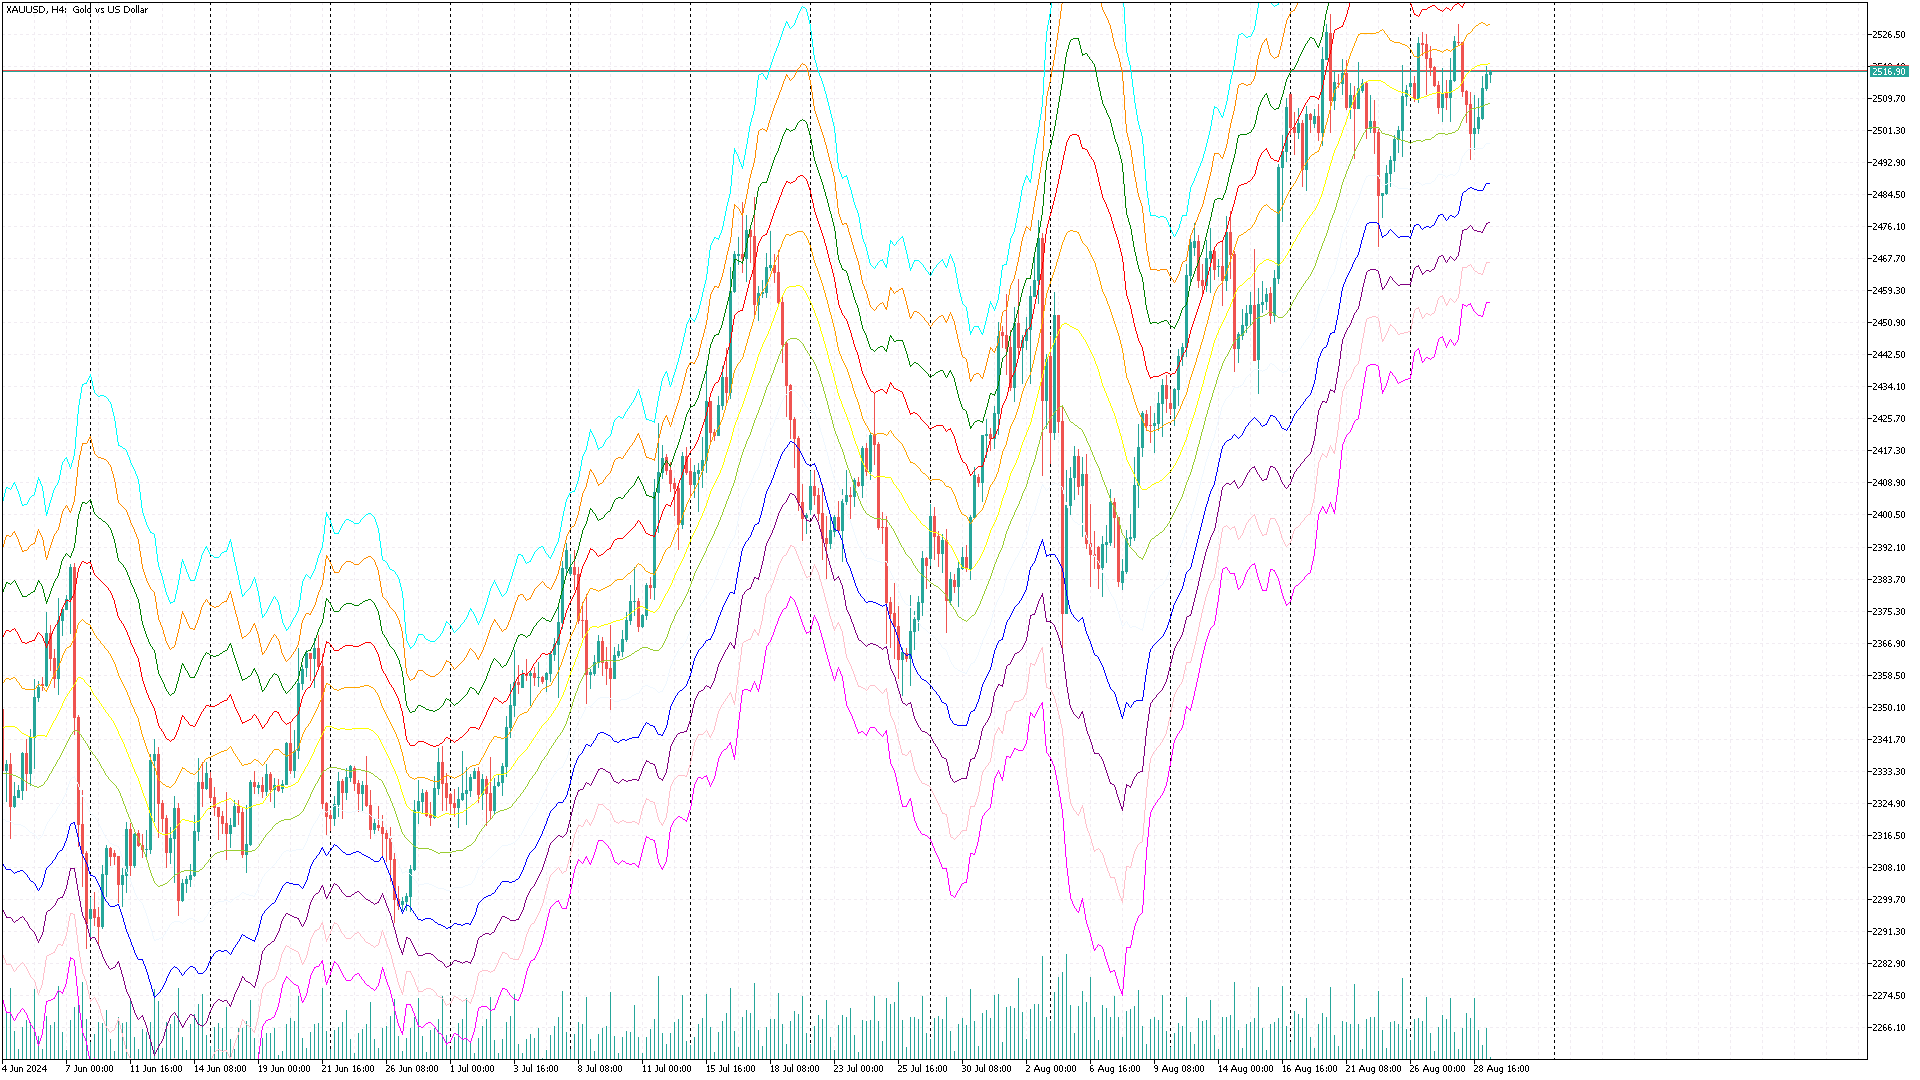
Der Multi Level ATR und Moving Average Band Indikator bietet eine umfassende Analyse von Preisbewegungen unter Berücksichtigung der Volatilität. Die visuelle Darstellung durch mehrere Bänder erleichtert die Identifizierung von Trend- und Konsolidierungsphasen sowie potenziellen Umkehrpunkten. Durch Anpassung der Parameter können Händler den Indikator auf ihre spezifischen Handelsbedürfnisse abstimmen.

Funktionen

  • Mehrere Bänder anzeigen: Preisniveaus auf der Basis von Hoch-, Mittel- und Tiefstwerten der gleitenden Durchschnitte sowie der ATR-Berechnungen, visualisiert durch 6 dynamische Bänder in verschiedenen Farben (Rot, Orange, Gelb, Grün, Blau, Lila).
  • ATR-Volatilitätsbänder: Nutzung von ATR-Multiplikatoren zur Anpassung der Bänder basierend auf der Volatilität, um potenzielle Preisumkehrungen oder Fortsetzungen klar darzustellen.
  • Anpassbare Parameter: Vollständige Anpassung der ATR-Multiplikatoren und der Perioden der gleitenden Durchschnitte für verschiedene Marktbedingungen und Handelsstrategien.
  • Klarheit bei der Trendidentifizierung: Die Bänder dehnen sich basierend auf der Volatilität aus oder ziehen sich zusammen, um Trends, Konsolidierungsphasen und mögliche Ausbrüche leichter zu identifizieren.
  • Kompatibilität mit mehreren Zeitrahmen: Geeignet für alle Handelszeitrahmen wie Scalp-Trading, Swing-Trading oder langfristige Investitionen.

Verwendung

  • Trendidentifizierung: Verwenden Sie diesen Indikator zur Unterscheidung zwischen Trendmärkten und Seitwärtsmärkten. Wenn sich die Bänder ausdehnen, deutet dies auf eine erhöhte Volatilität und mögliche Ausbrüche hin, während sich die Bänder zusammenziehen, was auf eine niedrige Volatilität und Konsolidierung hinweist.
  • Umkehrsignale: Wenn der Preis die äußeren Bänder berührt, kann dies oft auf mögliche Umkehrpunkte hindeuten. Dies kann Händlern helfen, Stop-Loss-Levels festzulegen, Gewinnziele zu planen oder Einstiegspunkte zu bestimmen.
  • Risikomanagement: Die Volatilitätsbänder des Indikators, die aus der ATR abgeleitet sind, bieten Einblicke in geeignete Stop-Loss-Distanzen und Positionsgrößen.

Anpassungsoptionen

  • ATR-Multiplikatoren: Anpassen der Multiplikatoren, um die Sensitivität der Bänder gegenüber der Volatilität zu regulieren.
  • Perioden der gleitenden Durchschnitte: Auswahl der Perioden der gleitenden Durchschnitte entsprechend der bevorzugten Handelsstrategie und den zu verwendenden Werkzeugen.

Ideale Anwendungsbereiche

  • Trend-Händler: Hilft bei der Bestimmung der Stärke und Richtung von Trends.
  • Umkehrhändler: Analysiert die Interaktion des Preises mit den äußeren Bändern, um mögliche Umkehrpunkte zu identifizieren.
  • Volatilitätsbasierte Strategien: Bietet visuelle Einblicke in Phasen hoher und niedriger Volatilität, um Handelsstrategien anzupassen.

Linienverständnis

Der Indikator berechnet 12 Linien, die aus den gleitenden Durchschnitten und dem ATR-Multiplikator abgeleitet sind:

  • Oberste Linie: Die Linie über dem Preis, abgeleitet von HighMa (Hoch-MA) multipliziert mit dem ATR-Multiplikator.
  • Unterste Linie: Die Linie unter dem Preis, abgeleitet von LowMa (Tief-MA) multipliziert mit dem ATR-Multiplikator.

Handelsstrategie

Buffer und deren Farben

  1. FirstBuffer (Farbe: Rot)

    • Zweck: Oberes Ende des höchsten ATR-Bandes anzuzeigen.
    • Berechnung: FirstBuffer[i] = HighMa[0] + 2 * AtrMultiplier * currAtr[0]
    • Beschreibung: Zeigt den Wert an, der durch Addition des zweifachen ATR-Multiplikators zum Hoch-MA-Wert erhalten wird. Kennzeichnet höhere Widerstandsniveaus.
  2. SecondBuffer (Farbe: Orange)

    • Zweck: Oberes Ende des mittleren ATR-Bandes anzuzeigen.
    • Berechnung: SecondBuffer[i] = HighMa[0] + AtrMultiplier * currAtr[0]
    • Beschreibung: Zeigt den Wert an, der durch Addition des ATR-Multiplikators zum Hoch-MA-Wert erhalten wird. Kennzeichnet mittlere Widerstandsniveaus.
  3. ThirdBuffer (Farbe: Gelb)

    • Zweck: Hoch-MA anzuzeigen.
    • Berechnung: ThirdBuffer[i] = HighMa[0]
    • Beschreibung: Zeigt den Hoch-MA-Wert an und dient als Referenzlinie oder Mittelwert.
  4. FourthBuffer (Farbe: Grün)

    • Zweck: Tief-MA anzuzeigen.
    • Berechnung: FourthBuffer[i] = LowMa[0]
    • Beschreibung: Zeigt den Tief-MA-Wert an und dient als untere Referenzlinie oder Mittelwert.
  5. FifthBuffer (Farbe: Alice Blue)

    • Zweck: Unteres Ende des mittleren ATR-Bandes anzuzeigen.
    • Berechnung: FifthBuffer[i] = LowMa[0] - AtrMultiplier * currAtr[0]
    • Beschreibung: Zeigt den Wert an, der durch Subtrahieren des ATR-Multiplikators vom Tief-MA-Wert erhalten wird. Kennzeichnet mittlere Unterstützungsniveaus.
  6. SixthBuffer (Farbe: Deep Sky Blue)

    • Zweck: Unteres Ende des höchsten ATR-Bandes anzuzeigen.
    • Berechnung: SixthBuffer[i] = LowMa[0] - 2 * AtrMultiplier * currAtr[0]
    • Beschreibung: Zeigt den Wert an, der durch Subtrahieren des doppelten ATR-Multiplikators vom Tief-MA-Wert erhalten wird. Kennzeichnet höhere Unterstützungsniveaus.

Technische Vorteile

Dieses Indikator bietet dem Benutzer visuelle Informationen zur Erkennung von Marktvolatilität und möglichen Trendwenden oder -fortsetzungen. Die Mehrfachbänder ermöglichen die Beobachtung von Trends und Volatilität auf verschiedenen Preisniveaus und unterstützen eine genauere Trendanalyse basierend auf gleitenden Durchschnitten.

Fazit

Der Multi Level ATR und Moving Average Band Indikator ist ein leistungsstarkes Werkzeug zur Analyse von Preisbewegungen und zur Berücksichtigung der Volatilität für klare Handelssignale. Mit den mehreren Bändern können verschiedene Marktbedingungen analysiert und Handelsstrategien angepasst werden.

Empfohlene Produkte
Smooth price for Monarch
Konstantin Gruzdev
5 (1)
The Smooth Price technical indicator is used for plotting a smoothed line as close to the price of the financial instrument as possible, and serves to eliminate its noise components. The indicator is part of the Monarch trading system, but here it is presented as an independent technical analysis tool. The indicator is based on the cluster digital filter , which, unlike the ClusterSMA , is applied directly to the price time series. Smooth Price does not redraw (except the very last, zero bar) an
Wir stellen den revolutionären MT5-Indikator DARWIN Assistant   vor – Ihr ultimativer Zugang zur Welt des erfolgreichen Handels! DARWIN Assistant   wurde mit Präzision und Fachwissen entwickelt und verfolgt eine spezielle Strategie, die die Leistungsfähigkeit fortschrittlicher technischer Indikatoren – RSI, Stochastik, CCI und Trends – über alle Zeitrahmen hinweg nutzt. Machen Sie sich auf ein außergewöhnliches Handelserlebnis gefasst, denn dieser hochmoderne Indikator bietet Ihnen die genauest
Premium-Level ist ein einzigartiger Indikator mit mehr als 80% Genauigkeit der richtigen Vorhersagen! Dieser Indikator wurde von den besten Trading-Spezialisten seit mehr als zwei Monaten getestet! Den Indikator des Autors finden Sie nirgendwo anders! Anhand der Screenshots können Sie sich von der Genauigkeit dieses Tools überzeugen! 1 ist ideal für den Handel mit binären Optionen mit einer Ablaufzeit von 1 Kerze. 2 funktioniert bei allen Währungspaaren, Aktien, Rohstoffen, Kryptowähr
Looking for reliable levels on a price chart? Already tired of searching for similar indicators? Are the levels not working out as they should? Then this is the indicator for you. Volume Prices Universal is a reliable indicator of horizontal volumes. What does it show? First of all, the main idea of ​​the indicator is to display at which price mark the price has been for the longest time. Thus, the display of price volumes on the price chart is formed. With the help of which you can very simp
Forex Relative Performance indicator This indicator calculates the relative strength of major currencies against the US dollar. The basic idea behind this indicator is "to buy strong currency and to sell weak currency". This indicator allows you to quickly identify the best forex pair to trade according to your trading style (Intraday, Scalping, Swing, or Long Term)
Wave Impulse OmegaScalper - is the manual system for scalping. In many cases Indicator "eats" almost all possible trend wave. System defines up price wave and down price wave. Inside the exact wave - system defines true trend movement and choppy market. Indicator plots signals while market is trending, powerfull and has quiet good volatility. This is complete system with enter and exit points. Main Indicator's Features Signals are not repaint,non-late or disappear(exept cases when system recalcu
The indicator is a gold mine that works with the MACDI strategy with alert supported by AI it working on gold 5m time frame with 92% win the stratige take 15 pip tp and 15 stop 1:1 follow us on telegram : t.me/tuq98 youtube : youtube.com/ssfx1 green color its buy with alert red color its sell with alert this indicator is one from top 10 in greece and one from top 5 in iraq
Di Napoli MACD MT5
Samil Bozuyuk
4.6 (5)
Non-proprietary study of Joe Dinapoli used for trend analysis. The indicator gives trend signals when the fast line penetrates the slow line. These signals remain intact until another penetration occurs. The signal is confirmed at the close of the period. It is applicable for all timeframes.   Parameters Fast EMA: period of the fast moving average. Slow EMA: period of the slow moving average. Signal EMA: period of the signal line.                              ************************************
FREE
SQN Max indicator for MT5 by ITC
Renaud Herve Francois Candel
Sqn Max Indicator Sqn Max is an exclusive indicator to trade the market with high effectiveness. The indicator is based on price action, volatility and trend. This indicator is as simple as possible but not too simple. The indicator can generate alerts to ease the trading process. You don't have to stay all day in front of your screen. The indicator can be used with any class of assets and with any time frame. It is possible to achieve better results trading our list of selected assets. W
Naked Forex Big Shadow indicator for MT5
Renaud Herve Francois Candel
5 (1)
Naked Forex Big Shadow Indicator Big Shadow Indicator is a pattern recognition indicator for Forex, Stocks, Indices, Futures, Commodities and Cryptos. When you have a Big Shadow on your chart then this is a strong signal meaning that you might be ahead of a reversal. You can take other elements (momentum, trend, volatility, price action, fundamentals) to build a complete strategy and confirm your entries. Beware that you might not make money just following the arrows generated by the pattern r
WanaScalper
Isaac Wanasolo
1 (1)
A scalping indicator based on mathematical patterns, which on average gives signals with relatively small SL, and also occasionally helps to catch big moves in the markets (more information in the video) This indicator has three main types of notifications: The first type warns of a possible/upcoming signal on the next bar The second type indicates the presence of a ready signal to enter the market/open a position The third type is for SL and TP levels - you will be notified every time price r
How to use? • Buy Low and Sell High. • Brighter zones means strong Support or Resistance. • Weaker zones appear lighter. • Brighter zones are formed by overlapping of lines from multiple levels of support or resistance. Indicator Menu • The indicator can input 5 different Lengths. • The default settings uses 13, 21, 52, 100 & 200. • Every option are customizable.
The "RMA Signal Indicator MT5" refers to an indicator called "RMA" (Running Moving Average) Signal Indicator designed specifically for the MetaTrader 5 (MT5) trading platform. The RMA is a variation of the Moving Average indicator that emphasizes recent price data. The specific details and functionality of the "RMA Signal Indicator MT5" may depend on the developer or the version you are using. However, in general, here is a general approach to using a signal indicator like RMA on the MT5 platfor
Win43 Scalper
Eadvisors Software Inc.
O novo s43 Scalper para Mini-Índice (WIN-IND) faz operações de curto prazo no timeframe 1min buscando pequenas variações do mercado, utiliza nova tecnologia de trade, os resultados no intraday são íncríveis, confira:      Após a instalação adicione no gráfico dos instrumentos win para visualizar os resultados no backteste. Recomendamos o timeframe de 1min.
Der Indikator erstellt aktuelle Notierungen, die mit historischen verglichen werden können, und auf dieser Grundlage eine Preisbewegungsprognose erstellen. Der Indikator verfügt über ein Textfeld zur schnellen Navigation zum gewünschten Datum. Optionen: Symbol - Auswahl des Symbols, das der Indikator anzeigen soll; SymbolPeriod - Auswahl des Zeitraums, aus dem der Indikator Daten aufnimmt; IndicatorColor - Indikatorfarbe; HorisontalShift - Verschiebung der vom Indikator gezeichnet
Atomic Analyst MT5
Issam Kassas
4.5 (16)
Zunächst einmal ist es erwähnenswert, dass dieser Handelsindikator nicht neu malt, nicht neu zeichnet und keine Verzögerung aufweist, was ihn sowohl für manuellen als auch für Roboterhandel ideal macht. Benutzerhandbuch: Einstellungen, Eingaben und Strategie. Der Atom-Analyst ist ein PA-Preisaktionsindikator, der die Stärke und das Momentum des Preises nutzt, um einen besseren Vorteil auf dem Markt zu finden. Ausgestattet mit fortschrittlichen Filtern, die helfen, Rauschen und falsche Signale z
FOTSI Oscillator MT5
Sidi Mohamed El Alaoui
FOTSI (Forex Overview True Strength Index) for MT5! FOTSI is an indicator that analyzes the relative strength of currencies in major Forex pairs. It aims to anticipate corrections in currency pairs following strong trends by identifying potential entry signals through overbought and oversold target areas. Theoretical Logic of Construction: Calculation of Individual Currency Momentum: FOTSI starts by calculating the momentum for each currency pair that includes a specific currency, then aggregat
Super Zone   For several years of observing the principles of the market, Super Zone worked, both then and now, because the indicator  allows you to see the trading range of the  week and even the month that major market participants use. It’s very easy to use, we work on H4 in the weekly range (  in the tester it doesn’t work in the demo mode  ) - we sell from the upper zones, we buy from the lower ones. It marks the zones from the beginning of the week (month) that are  not redrawn  , works on
MSnR Lines
Pierre Paul Amoussou
MSnR Lines ist ein benutzerdefinierter Indikator, der dazu dient, Unterstützungs- und Widerstandsebenen auf einem Chart anzuzeigen. Diese Ebenen basieren auf der malaysischen Theorie zu Unterstützung und Widerstand, die Ebenen nicht als Bereiche, sondern als spezifische Preisniveaus definiert, die aus Spitzen und Tälern von Liniendiagrammen abgeleitet sind. Eigenschaften: Drei Arten von Ebenen: A-Level, V-Level und Gap Level. Frische-Anzeige für Ebenen: Frische Ebenen sind signifikanter als unfr
The Quantum VPOC indicator has been developed to expand the two dimensional study of volume and price, to a three dimensional one which embraces time. The volume/price/time relationship then provides real insight to the inner workings of the market and the heartbeat of sentiment and risk which drives the price action accordingly. The Quantum VPOC indicator displays several key pieces of information on the chart as follows: Volume Profile - this appears as a histogram of volume on the vertical pr
Neural Bar Impulse is an indicator based on a neural network created and specially trained to predict the potential impulse of each next market bar. By bar impulse we mean the tendency of the market price to update the maximum or minimum of the bar relative to its opening price. We chose this particular feature of market bars because, based on our own research, we discovered an interesting feature of bar impulses to be harbingers of a change in price trend movements. The neural network we c
Präsentieren wir den Gold Blitz Scalping Indikator, das ultimative Werkzeug für das Scalping von Gold auf den Zeitrahmen M1, M5 und M15. Entwickelt mit fortschrittlichen AI-Neuronalen Netzwerken, garantiert dieser Nicht-Repaint-Indikator konsistente Rentabilität und überlegene Handelsergebnisse. Der Gold Blitz Scalping Indikator ist für Präzision und Effizienz optimiert und liefert die besten Ergebnisse auf dem M15-Zeitrahmen. Hauptmerkmale: Fortschrittliche AI-Neuronale Netzwerke: Nutzen Sie
The ChanLun or Chan theory is one of the most popular trading theories in China. But it seems like that it has little influence in western countries. Actually, the Chan Theory is based on a sophisticated mathematical model. The basic idea ChanLun is to simplify the bar chart by its model. With the help of ChanLun, a trader can analyze and predict the trend of future goods, stocks. In ChanLun, there are several basic elements called fractals, strokes, line segments and pivots . A trader should p
AlgoEAs Trend Dashboard V1 Indicator for MT5 Introduction: This is a Dashboard Indicator based on 7 built in Multi Timeframe indicators. This strategy gives Buy/Sell Ideas based on 9 trend states. Easy to view gas guage to view current trend. Has as optional Alerts to enable with 9 messages. Run on M15 chart, with M15, H1, and H4 indicator time frames. Great tool! Features: Non-Repainting Dashboard For Desktop MT5 Only, Works On Any Mt5 Pair Great for Intraday and Swing Trading Easy view ga
The indicator refers to the means of probabilistic analysis. Prediction is performed by the Monte Carlo method together with a mathematical model of a neuron. But, the modeling of samples for this method is made not artificially, but comes from the original "nature", that is, from history. The number of samples and the detail of their modeling is achieved using the lower (relative current) timeframe. Indicator algorithm : In general terms, the algorithm boils down to the fact that the ind
Candle Pattern Finder MT5
Pavel Zamoshnikov
4.2 (5)
This indicator searches for candlestick patterns. Its operation principle is based on Candlestick Charting Explained: Timeless Techniques for Trading Stocks and Futures by Gregory L. Morris. If a pattern is detected, the indicator displays a message at a bar closure. If you trade using the MetaTrader 4 terminal, then you can download the full analogue of the " Candle Pattern Finder for MT4 " indicator It recognizes the following patterns: Bullish/Bearish (possible settings in brackets) : Hamme
SolarTrade Suite Finanzindikator: Venus Market Indicator – Ihr zuverlässiger Führer in der Welt der Finanzmärkte! Dies ist ein Oszillator, der spezielle innovative und fortschrittliche Algorithmen zur Berechnung seines Wertes verwendet und zudem ein ansprechendes Design aufweist. Die Messwerte dieses Indikators sind sehr leicht zu verstehen: Blau – Kaufen, Rot – Verkaufen. Je heller die Farbe, desto stärker das Signal. Sehen Sie sich unsere anderen Produkte aus der SolarTrade Suite-Reih
This indicator identifies and displays zones, as it were areas of strength, where the price will unfold. The indicator can work on any chart, any instrument, at any timeframe. The indicator has two modes. The indicator is equipped with a control panel with buttons for convenience and split into two modes. Manual mode: To work with manual mode, you need to press the NEW button, a segment will appear. This segment is stretched over the movement and the LVL button is pressed. The level is displayed
Gioteen Volatility Index (GVI) - your ultimate solution to overcoming market unpredictability and maximizing trading opportunities. This revolutionary indicator helps you in lowering your losing trades due to choppy market movements. The GVI is designed to measure market volatility, providing you with valuable insights to identify the most favorable trading prospects. Its intuitive interface consists of a dynamic red line representing the volatility index, accompanied by blue line that indicate
Dies ist wahrscheinlich der vollständigste Indikator für die automatische Erkennung der harmonischen Preisbildung, den Sie für die MetaTrader-Plattform finden können. Es erkennt 19 verschiedene Muster, nimmt Fibonacci-Projektionen genauso ernst wie Sie, zeigt die potenzielle Umkehrzone (PRZ) an und findet geeignete Stop-Loss- und Take-Profit-Werte. [ Installationsanleitung | Update-Anleitung | Fehlerbehebung | FAQ | Alle Produkte ] Es erkennt 19 verschiedene harmonische Preisbildungen Dar
Käufer dieses Produkts erwarben auch
TrendMaestro5
Stefano Frisetti
note: this indicator is for METATRADER4, if you want the version for METATRADER5 this is the link:  https://www.mql5.com/it/market/product/108106 TRENDMAESTRO ver 2.4 TRENDMAESTRO recognizes a new TREND in the bud, he never makes mistakes. The certainty of identifying a new TREND is priceless. DESCRIPTION TRENDMAESTRO identifies a new TREND in the bud, this indicator examines the volatility, volumes and momentum to identify the moment in which there is an explosion of one or more of these data a
IVISTscalp5
Vadym Zhukovskyi
5 (5)
Wir stellen Ihnen den iVISTscalp5-Indikator vor, der nicht nur einzigartig, sondern auch effektiv im Handel ist. Dieser Indikator basiert auf Zeitdaten und ist das Ergebnis jahrelanger Erfahrung und eingehender Analyse der Finanzmärkte. Der iVISTscalp5-Indikator ist ein ausgezeichnetes Werkzeug für manuellen Handel. Bequemlichkeit, Einfachheit und Visualisierung - die gesamte Komplexität ist verborgen. Wir haben die Einstellungen und Verwendung des iVISTscalp5-Indikators auf das Maximum vereinfa
VTrende Pro
Andrii Diachenko
5 (1)
VTrende Pro - MTF indicator for trend trading with a display panel for MT5 *** Videos can be translated into any language using subtitles (video language - Russian) Although the signals of the VTrende Pro indicator can be used as signals of a full-fledged trading system, it is recommended to use them in conjunction with the Bill Williams TS. VTrende Pro is an extended version of the VTrende indicator. Difference between Pro version and VTrende: - Time zones - Signal V - signal 1-2 waves
The indicator is designed to close positions on the market in time. For example: to take profits ahead of schedule if the price has not reached TakeProfit, and the market is turning around. The indicator analyzes the momentum, not the trend. He does not give any information about the trend. The indicator is well suited for finding divergence. The Ershov 38 Parrots indicator dynamically adjusts to the market and detects price movement impulses of medium and high amplitude. It almost does not rea
Introducing the Power Trade Plus indicator designed by a small group of traders with a few years of experience trading the market profitably.  The Power Trade Plus is derived from the Power Trade indicator,  the indicator strive in powerful sniper entries and take profit levels,  with an algorithm that's can determine the markets volatility and Provides entries based on the current market volatility. This indicator is much more effective in stock ,currencies and indices.
Der Precision Index Oscillator (Pi-Osc) von Roger Medcalf von Precision Trading Systems Version 2 wurde sorgfältig neu codiert, um extrem schnell auf Ihrem Chart geladen zu werden, und es wurden einige andere technische Verbesserungen eingearbeitet, um die Erfahrung zu verbessern. Pi-Osc wurde entwickelt, um genaue Handelstimingsignale bereitzustellen, die darauf abzielen, extreme Erschöpfungspunkte zu finden, an die die Märkte gezwungen werden, um einfach die Stops aller herauszunehmen.
Contact us to receive a comprehensive user guide after purchasing. William Delbert Gann, commonly known as W.D. Gann, was an exceptional market analyst renowned for his unique trading style in the early 20th century.  His trading techniques were based on a blend of mathematics, geometry, astrology, and ancient mathematics. Gann believed that stock market movements followed specific patterns and cycles, rather than being random. His methodologies, celebrated for their accuracy and relevance, con
Dieser auf künstlicher Intelligenz basierende Indikator identifiziert mögliche Marktumkehrpunkte durch Auslesen des Fußabdrucks und signalisiert im Voraus kleine Marktbewegungen, bevor sie auftreten. Im Gegensatz zu Preis- und Volumenindikatoren, die „späte“ Einträge generieren, d. h. wenn bei einer Richtungsänderung bereits eine Bestätigung des Preises oder Volumens erfolgt ist und die Bewegung daher oft bereits beendet ist, signalisiert dieser Indikator basierend auf dem, was er in der Tabell
Fibonacci Suavizado
Cesar Juan Flores Navarro
Indicador en MQL5, que obtiene el promedio de 10 EMAS, que son alineadas según Fibonacci, obteniendo un promedio, que sera suavizado.  Se puede ingresar un numero desde 2 a N, que multiplica a los EMA-Fibonacci. Funciona en cualquier criptomoneda, etc. etc... pudiendo calcular el futuro segun la tendencia de las EMAS. Funciona excelentemente en tramos largos, determinando exactamente el mejor inicio/salida. El precio inicial por apertura sera por un periodo de tiempo, luego aumentará.
TREND HARMONY MT5 – Multi Timeframe Trend and Phase and Pullback Level Visualizer indicator for Metatrader5 The TREND HARMONY indicator automates deep trend analysis and generates visualizations for you. Take control of your trades by eliminating uncertainty! Revolutionize your trading experience with precision and insight through the TREND HARMONY Multi Timeframe indicator – your ultimate MT5 trend visualization indicator. [  Features and Manual   | MT4 version |   All Products   ] Are you t
Beschreibung Dieses Addon hat seinen Ursprung in meinem eigenem Handel. Ich wollte mir die Wartezeit auf der Suche nach Signalen sparen. Also fing ich an, mein eigenes Addon zu schreiben und nannte es "LifetimeSaver", weil es genau das für mich ist.  Da dieses Addon jedoch nicht nur für meinen persönlichen Handel bestimmt sein sollte, habe ich den LifetimeSaver erweitert sodass er nun anpassbar auf Ihre Bedürfnisse ist.  Funktionen: Benachrichtigung an Ihrem definierten Ziel/Signal Benachrich
EQ Cutrim Theory
Marco Aurelio Santos Costa
Ronal Cutrim has been a dedicated mathematician for 14 years and has more than 10 years of experience in the financial market. The concept of the theory is simple, find imbalance between buyers and sellers. Which makes a lot of sense, because nothing goes up forever, nothing falls forever.   When you find an asset with a mathematical probability of unbalanced equilibrium, it is a great way to get into trading:  TUTORIAL: Turn on the subtitles, the video is subtitled
Классификатор силы тренда. Показания на истории не меняет. Изменяется классификация только незакрытого бара. По идее подобен полной системе ASCTrend, сигнальный модуль которой, точнее его аппроксимация в несколько "урезанном" виде, есть в свободном доступе, а также в терминале как сигнальный индикатор SilverTrend . Точной копией системы ASCTrend не является. Работает на всех инструментах и всех временных диапазонах. Индикатор использует несколько некоррелируемых между собой алгоритмов для класси
Currency Index Watcher is a simple and user-friendly tool for whoever wish to trade Forex using currencies indexes. Currency Index Watcher is configurable and usable directly from the panel. Indexes of 8 custom currencies EUR, USD, GBP, JPY, CHF, AUD, CAD, NZD (default) Any 3-chars symbol from your market watch could be used (BTC = bitcoin, RUB = ruble, CNH = yuan etc ...) : double click the symbol label  Ability to select which currencies and made-of pairs will be analyzed : check/uncheck want
SmartTrendMt5
Andrey Spiridonov
The SmartTrendMt5 trend indicator generates signals based on the principle of combined analysis of calculated reference points within the Keltner channel. The indicator plots the Keltner channel in a separate window (by default, red lines and a blue line - the middle of the channel), and also draws the histogram of calculated reference points for each candle (by default, the histogram bars are yellow). The should be attached to a chart of any timeframe and any trading symbol in the usual way.
Weis Wave with Alert MT5
Trade The Volume Waves Single Member P.C.
4.93 (14)
Limited time offer 40% Discount on six month, yearly and lifetime packages. Offer ends 31/8/2024. Six Month from 209$ to 125$ Yearly from 379$ to 227$ Lifetime from 599$ to 359$ Rental/Lifetime Package Options and Privileges  * For optimum results the yearly or lifetime package is suggested due to live training ! Rent Monthly Six Months   Yearly/Lifetime Weis Wave with Speed with Alert+Speed Index x x x Manual  x x x Quick Set up Video x x x Blog x x x Lifetime Updates x x x Setup and Training
Pendiente de Precio
Cesar Juan Flores Navarro
Indicador en base a la pendiente de la linea de precio, dibuja una línea de color cuando sube a base de los precios que previamente has sido procesados o linealizados, y cuando baja la pendiente la linea linealizada toma otro color. En este caso se a considerado 6 lineas de diferentes procesos desde pendientes largas hacia las cortas, observándose que cuando coincidan las pendientes se produce un máximo o mínimo, lo que a simple vista nos permitirá hacer una COMPRA O VENTA.
Индикатор Coefficient Of Determination (COD) представляет собой значение коэффициента детерминации или квадрат коэффициента корреляции между зависимой переменной — ценой и объясняющей переменной — тиковым объемом. Что это дает нам на практике? COD отлично распознает кульминацию трендовых движений, что позволяет подбирать оптимальные точки и ловить развороты рынка. Как использовать индикатор: Наиболее популярная торговая стратегия строится совместно с трендовым индикатором Moving Average (MA), пе
Fibonacci Multiple 12
Cesar Juan Flores Navarro
Fibonacci Múltiple 12, utiliza la serie fibonacci plasmado en el indicador fibonacci, aumentadolo 12 veces según su secuencia. El indicador fibonacci normalmente muestra una vez, el presente indicador se mostrara 12 veces empezando el numero que le indique siguiendo la secuencia. Se puede utilizar para ver la tendencia en periodos cortos y largos, de minutos a meses, solo aumentado el numero MULTIPLICA.
Recommended TimeFrame >= H1. 100% Non Repainted at any moment.  Use it carefully, only with Trend Direction. Trading Usage: 2 Variants: as Range System or as BreakOut System (Both Only With Trend Direction)::: (Always use StopLoss for minimise Risk); [1] as Range System: (Recommended) in UP TREND:  - BUY in Blue Line , then if price goes down by 50 points (on H1) open Second BUY.   Close in any Profit you wish: TrailingStop(45 points) or Close when Price touches upper Gold Line. in DOWN TR
En base a cálculos matemáticos de determino una linea Horizontal que cruza a todas las señales de trading, mostrando los máximos y mínimos. La linea horizontal parte en dos las subidas y bajadas de las señales de trading, de tan manera que es fácil identificar los máximos y mínimos, y es inteligente por que es sensible a las subidas y bajadas, afín de no quedarse en un solo lado por siempre, trabaja excelentemente con otros indicadores suavizadores ya que les garantiza que en un intervalo de tie
Spike Detector
Tete Adate Adjete
dieser Indikator ist ein Spike-Detektor-Indikator, es wurde speziell für den Handel mit Boom 1000, Boom 500, Crash 1000 und Crash 500 entwickelt Wir empfehlen, es nur für Derivat Boom- und Crash-Indizes zu verwenden Die Einstellung ist intuitiv, vertraut und einfach zu bedienen es hat Benachrichtigungsfunktionen; akustische Benachrichtigungen und Push-Benachrichtigungen. Dieses Tool ist einfach zu bedienen, einfach zu handhaben Dieses Update basiert auf verschiedenen Strategien für
Der Indikator verfolgt den Trend in 5 verschiedenen Chartzeiten für dasselbe Asset, basierend auf 6 Signalen für jede Chartzeit. Das Hauptziel des Indikators besteht darin, uns den Mehrheitstrend des finanziellen Vermögenswerts zu zeigen, in den er platziert wurde. Das System überträgt die Informationen der Trends in mehreren grafischen Zeiten. Auf diese Weise hat der Benutzer einen umfassenden Überblick über die Bewegung des Assets. Diese Art von Tool ermöglicht dem Benutzer eine höhere Tre
Limitless MT5
Dmitriy Kashevich
Limitless MT5 is a universal indicator suitable for every beginner and experienced trader. works on all currency pairs, cryptocurrencies, raw stocks Limitless MT5 - already configured and does not require additional configuration And now the main thing Why Limitless MT5? 1 complete lack of redrawing 2 two years of testing by the best specialists in trading 3 the accuracy of correct signals exceeds 80% 4 performed well in trading during news releases Trading rules 1 buy signa
Panel Visao axetrend
Danilo Maia Siqueira
Trendansichtsfeld; AutoSignals-Trend Der Indikator verfolgt den Trend in 5 verschiedenen Chartzeiten für dasselbe Asset, basierend auf 6 Signalen für jede Chartzeit. Das Hauptziel des Indikators besteht darin, uns den Mehrheitstrend des finanziellen Vermögenswerts zu zeigen, in den er platziert wurde. Das System überträgt die Informationen über die Trends in verschiedenen Grafikzeiten. Auf diese Weise hat der Benutzer einen umfassenden Überblick über die Bewegung des Assets. Durch d
Escalera Inteligente
Cesar Juan Flores Navarro
Indicador en MQL5, recibe la información del precio SUAVIZADO, lo procesa anulando los picos inteligentemente, y el resultado lo envía al desarrollo de la escalera que iniciara y subirá o bajara según el peldaño o INTERVALO ingresado Ingreso PERIODO = 50 (variar segun uso) Ingreso MULTIPLICA AL PERIODO = 1 (variar segun uso) Segun la configuración la escalera puede pegarse o separarse de los precios,, Se aplica toda la linea de tiempo, y a todas las divisas, etc.  
Seconds Charts
Aleksandr Goryachev
Micro  ******************* Секундные графики MT5 ********************** Более точного инструмента для входа в сделку вы не найдёте. Входные параметры: Timeframe, sek - период построения графика, секунды Displayed bars - отображаемые бары Step of price levels, pp, 0-off - шаг отрисовки ценовых уровней, пункты Scale points per bar, 0-off - масштаб в пунктах на бар Show lines - отображение текущих уровней Show comment - отображение комментария Standard color scheme - стандартная цветовая сх
QXS Market Scanner
Netlux Digital Kft.
QuantXMarketScanner is a multi assets indicator for MT5 - Mathematical model based on 7 custom moving averages indicators  - Adaptable on Currencies, Stocks and Crypto - Automatic setup, self optimized About QuantXsystem Products: –         Simple installation & integration into MT5   –         Unlimited License after purchase (for one user) –         Automatic pattern recognition to identify the best timing and price levels. –         Trading indicators are displayed directly and automatica
QuantXSTocks Trading Range Indicator for MT5: INSTRUCTIONS TO USE OUR INDICATOR:- User needs to take trade on Arrow or after an Arrow CandleStick, You can achieve up-to 35-125 pips target by this Indicator. Best Timeframes for Stocks and Indices are M30 and H1: AMAZON M30 (50 pips) TESLA M30 (50 pips) APPLE M30 (50 pips) ADOBE M30 (50 pips) NASDAQ100 H1 (125 pips) The above are the approximate amount of pips you can achieve by this Indicator, Green arrow appears to be buy arrow while the Red a
Super Suavizador
Cesar Juan Flores Navarro
Indicador en MQL5 que obtiene el promedio de 10 EMAS que son alineadas y procesadas según Fibonacci luego el promedio es suavizado"  Se ingresa un número de 2 a N que multiplica los EMA-Fibonacci y por consiguiente aumenta los fibonacci, resultando un promedio.   Se ingresa un número que suaviza los EMA-Fibonacci. Considerando los números 1/1 seria la suavización minima. Considerando los números 3/5 seria la suavización media. Considerando los números 10/30 seria la suavización alta.....etc
Weitere Produkte dieses Autors
TK Rainbow
Nguyen Trung Khiem
TK - Rainbow Indikator Beschreibung: Der TK - Rainbow Indikator ist ein robustes Werkzeug für die technische Analyse, das entwickelt wurde, um durch einen mehrzeiligen Ansatz eine klare Sicht auf die Markttrends zu bieten. Mit 30 Linien, die in verschiedenen Zeiträumen berechnet werden, bietet er eine umfassende Analyse der Preisbewegungen. Der Indikator verwendet ein Zwei-Farben-Schema, um Aufwärts- und Abwärtstrends hervorzuheben, wodurch die Interpretation der Marktbedingungen auf einen Blick
Auswahl:
Keine Bewertungen
Antwort auf eine Rezension