Volume Break Oscillator
- Indikatoren
- Roberto Bonati
- Version: 1.1
- Aktualisiert: 19 Juli 2024
- Aktivierungen: 10
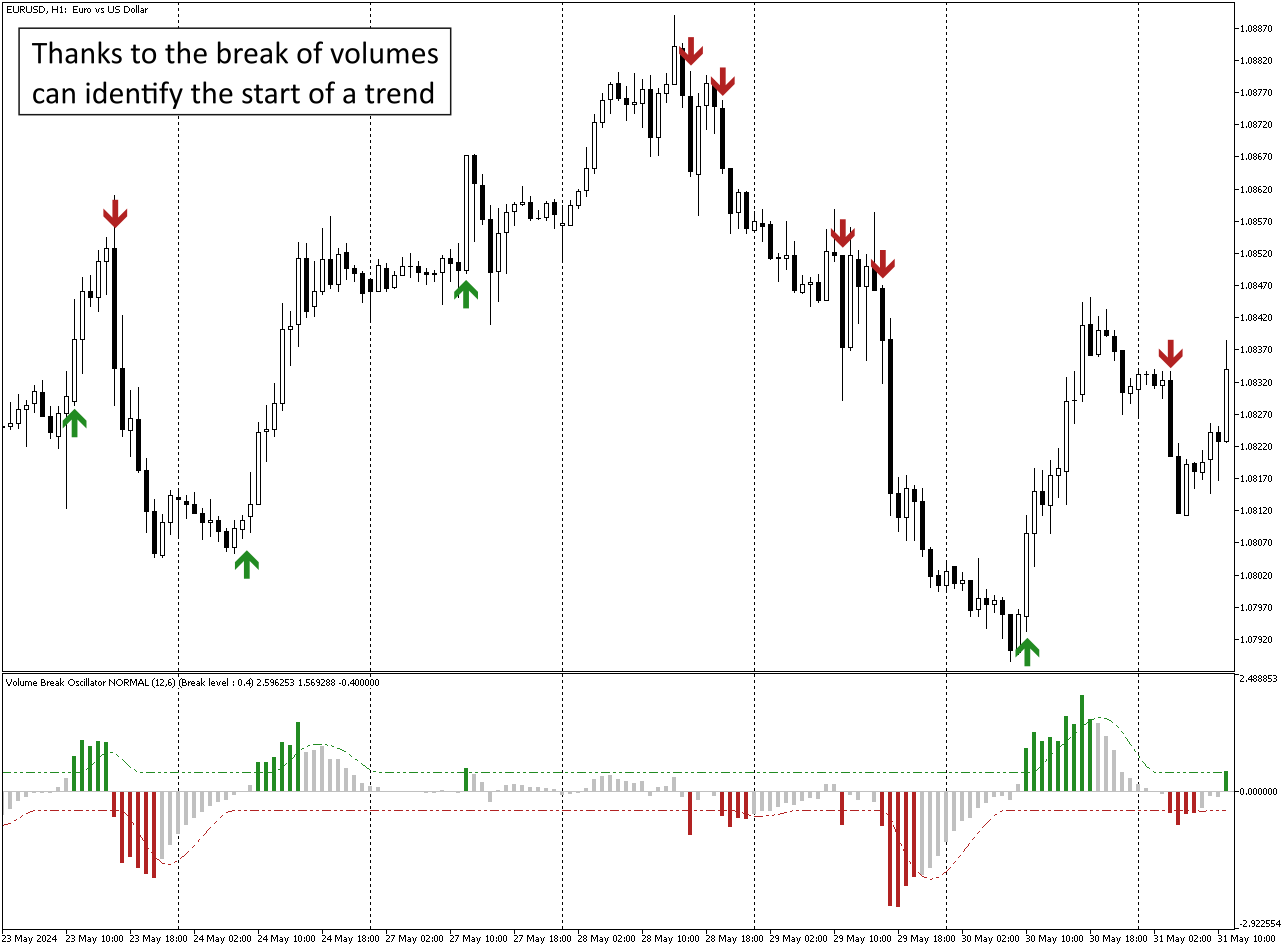
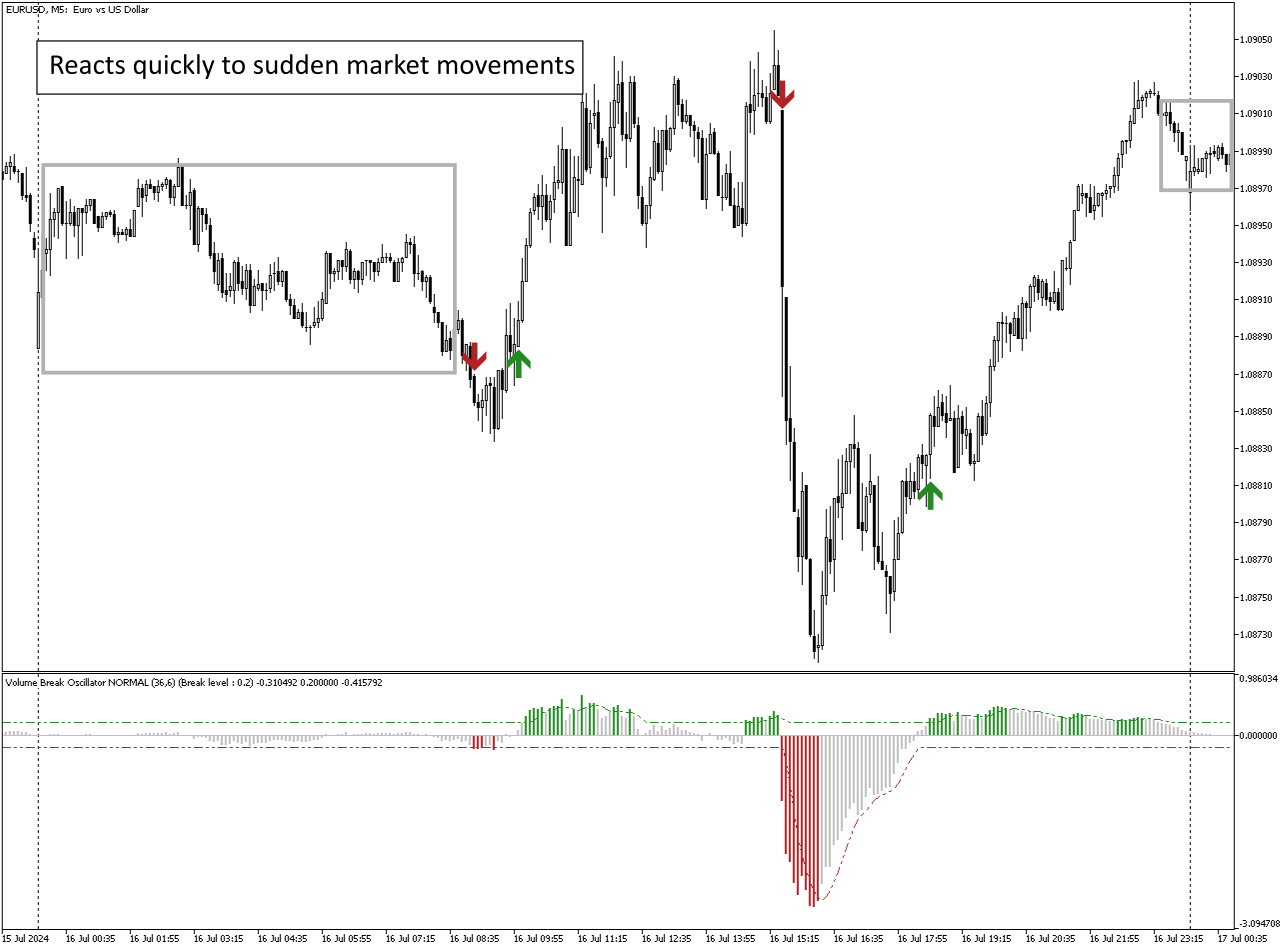
Volume Break Oscillator ist ein Indikator, der Preisbewegungen mit Volumentrends in Form eines Oszillators in Einklang bringt.
Ich wollte Volumenanalysen in meine Strategien integrieren, war aber von den meisten Volumenindikatoren wie OBV, Money Flow Index, A/D, aber auch Volume Weighted MACD und vielen anderen immer enttäuscht.
Deshalb habe ich diesen Indikator für mich selbst geschrieben, bin zufrieden mit seiner Nützlichkeit und habe mich daher entschieden, ihn auf dem Markt zu veröffentlichen.
Hauptmerkmale:
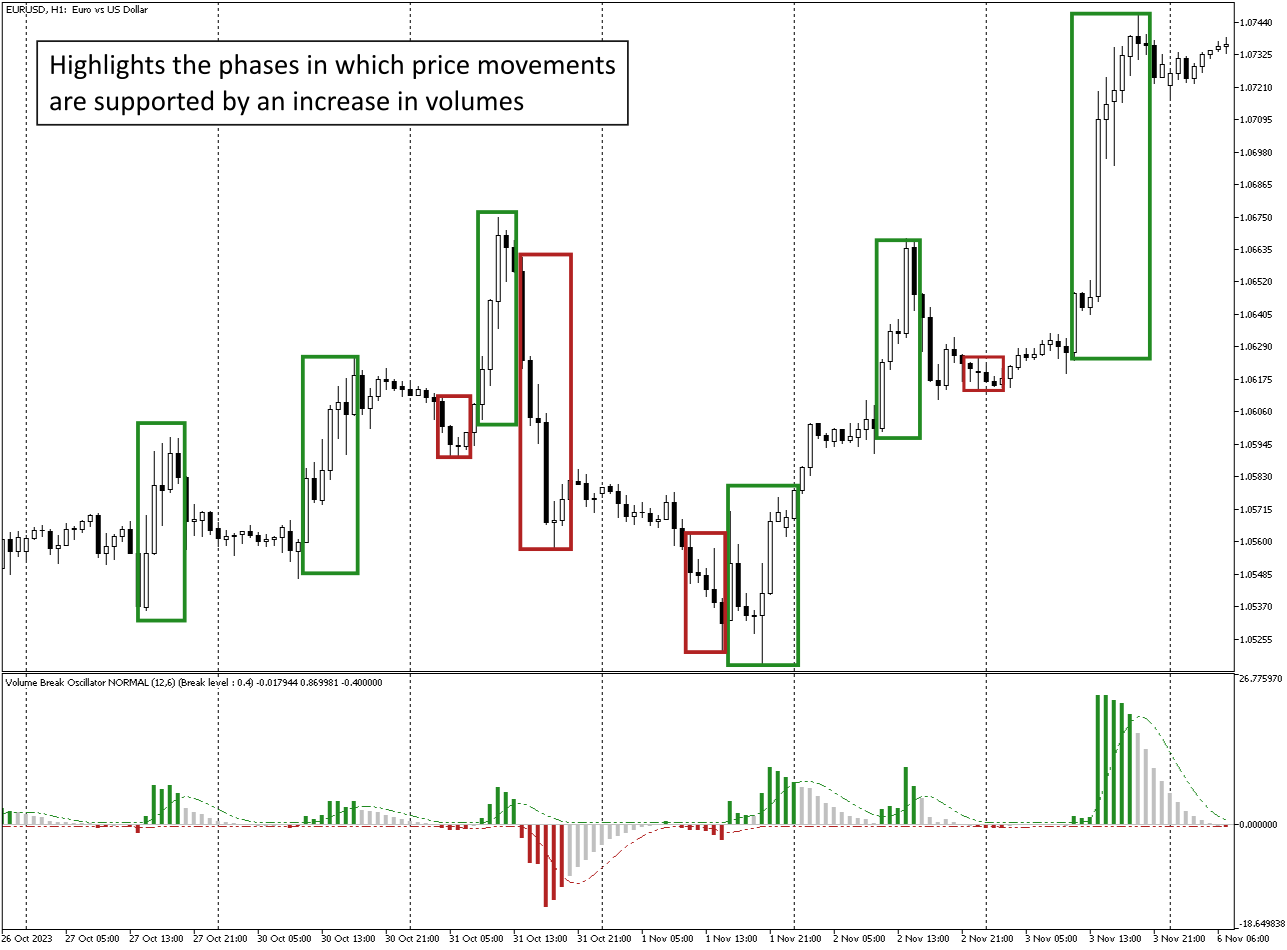
Er hebt die Phasen hervor, in denen sich der Preis in eine Richtung bewegt, die durch eine Zunahme (Einbruch) der Volumina unterstützt wird.
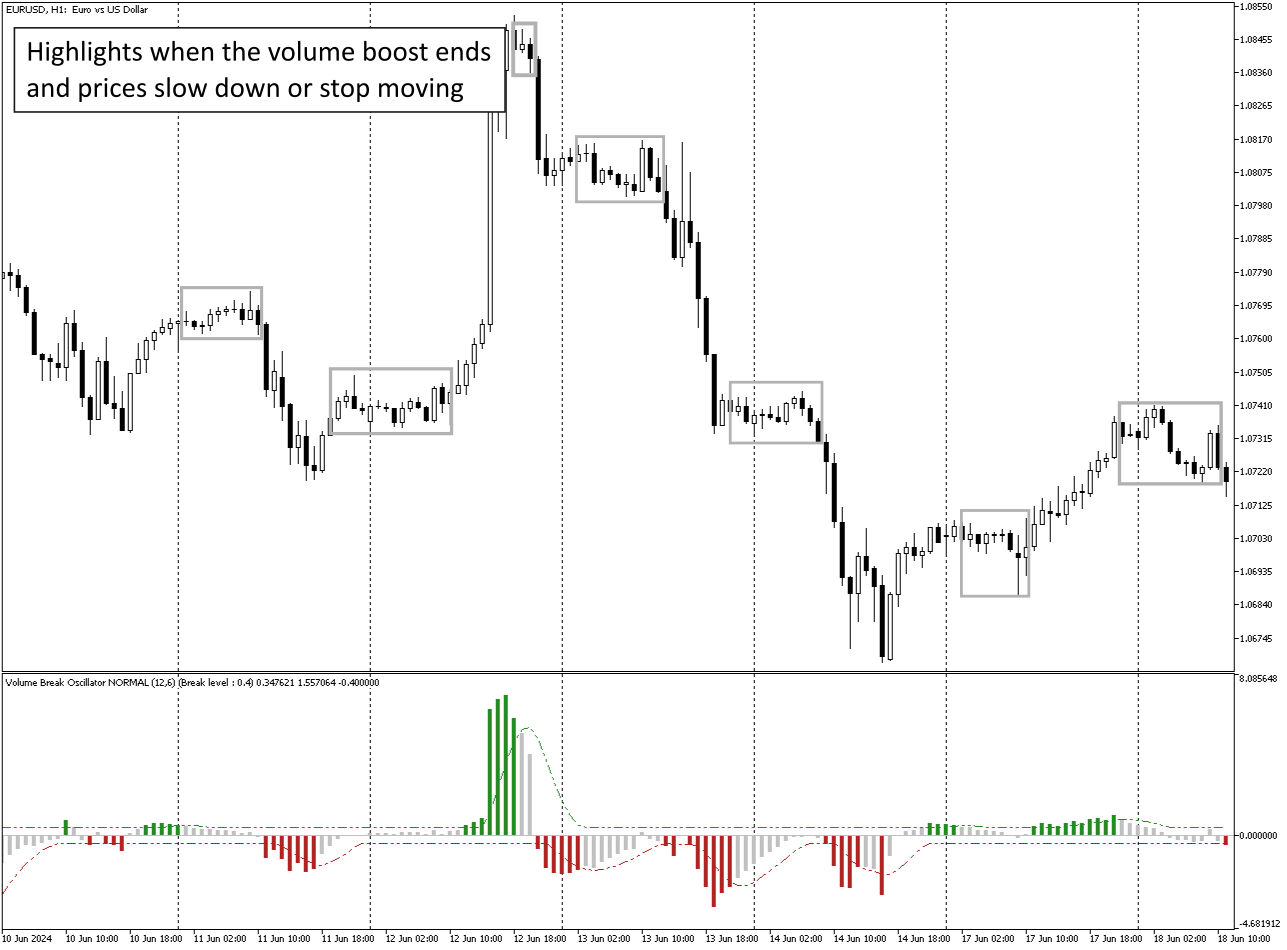
Er hebt die Phasen hervor, in denen der Volumenanstieg aufhört und der Markt daher schrumpft.
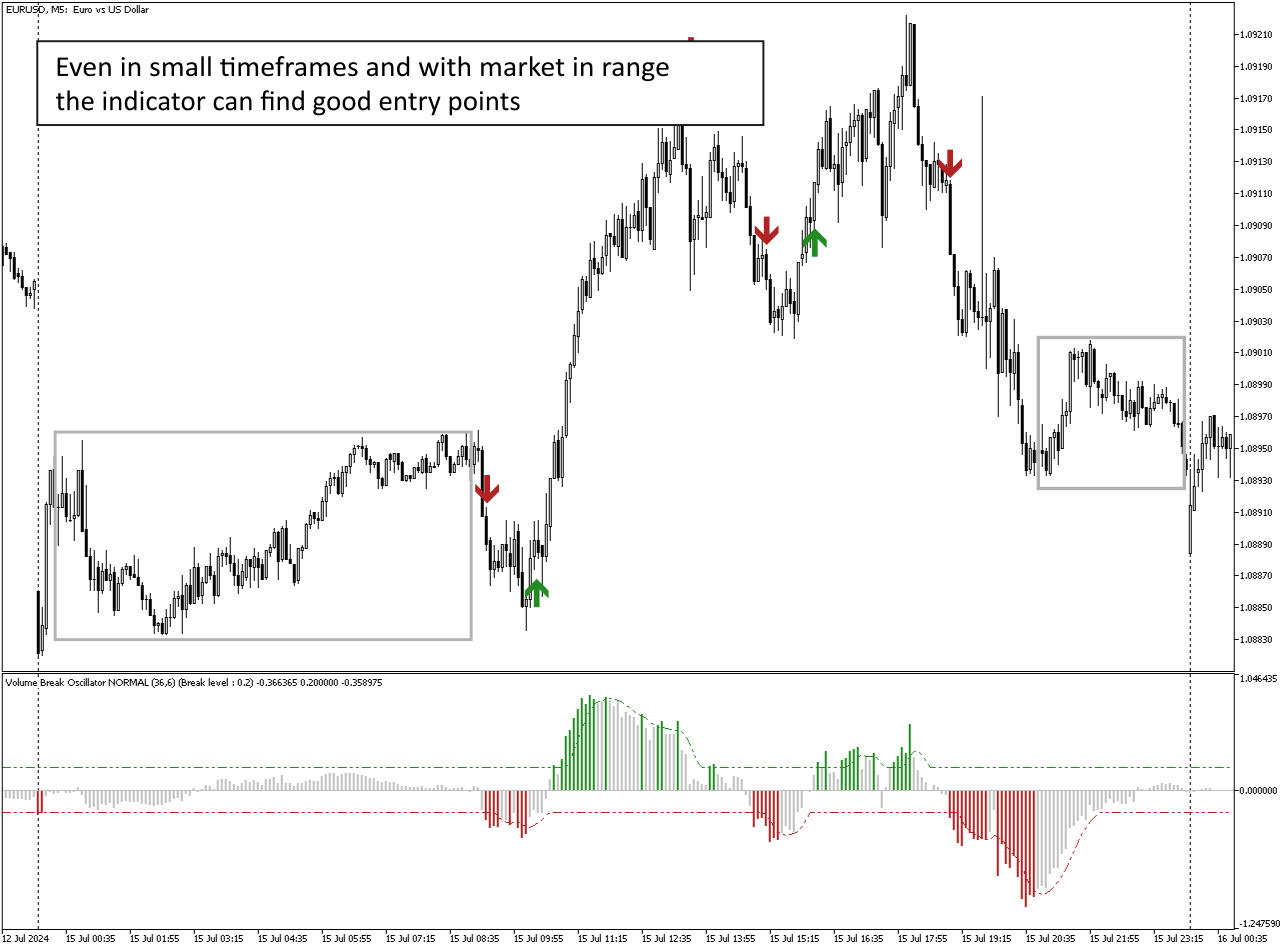
Er hebt die Phasen hervor, in denen sich, insbesondere beim Intraday-Handel mit Zeitrahmen (<=15 Minuten), weder Preise noch Volumina bewegen, sodass der Markt für einen zukünftigen Lauf bereit ist.
Filtert falsche Signale von anderen Expert Advisors heraus, wenn diese nicht durch eine Volumensteigerung unterstützt werden.
Erleichtert die Visualisierung von Trend- und Bereichsphasen.
Eingabeparameter:
Berechnungseinstellungen:
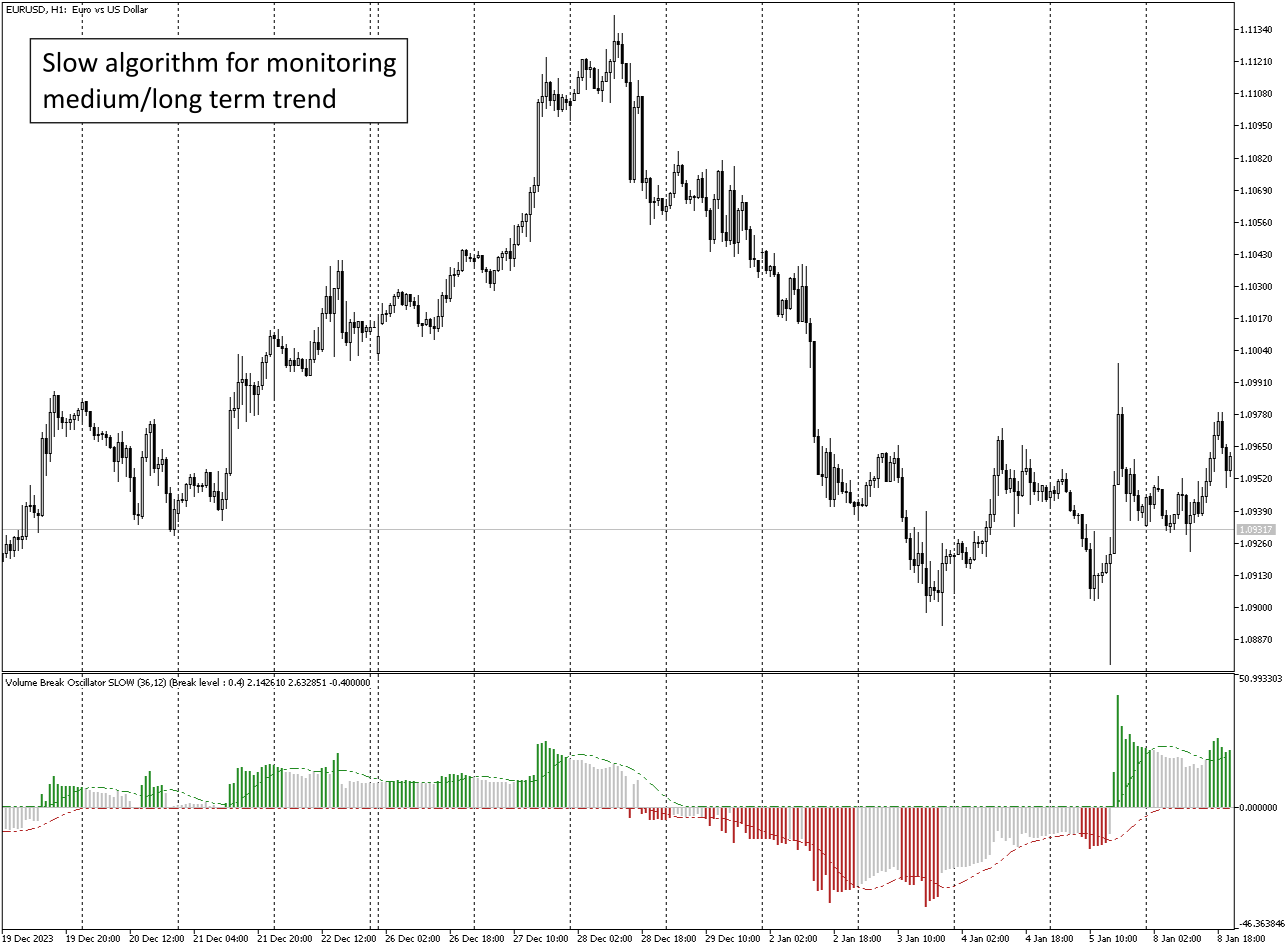
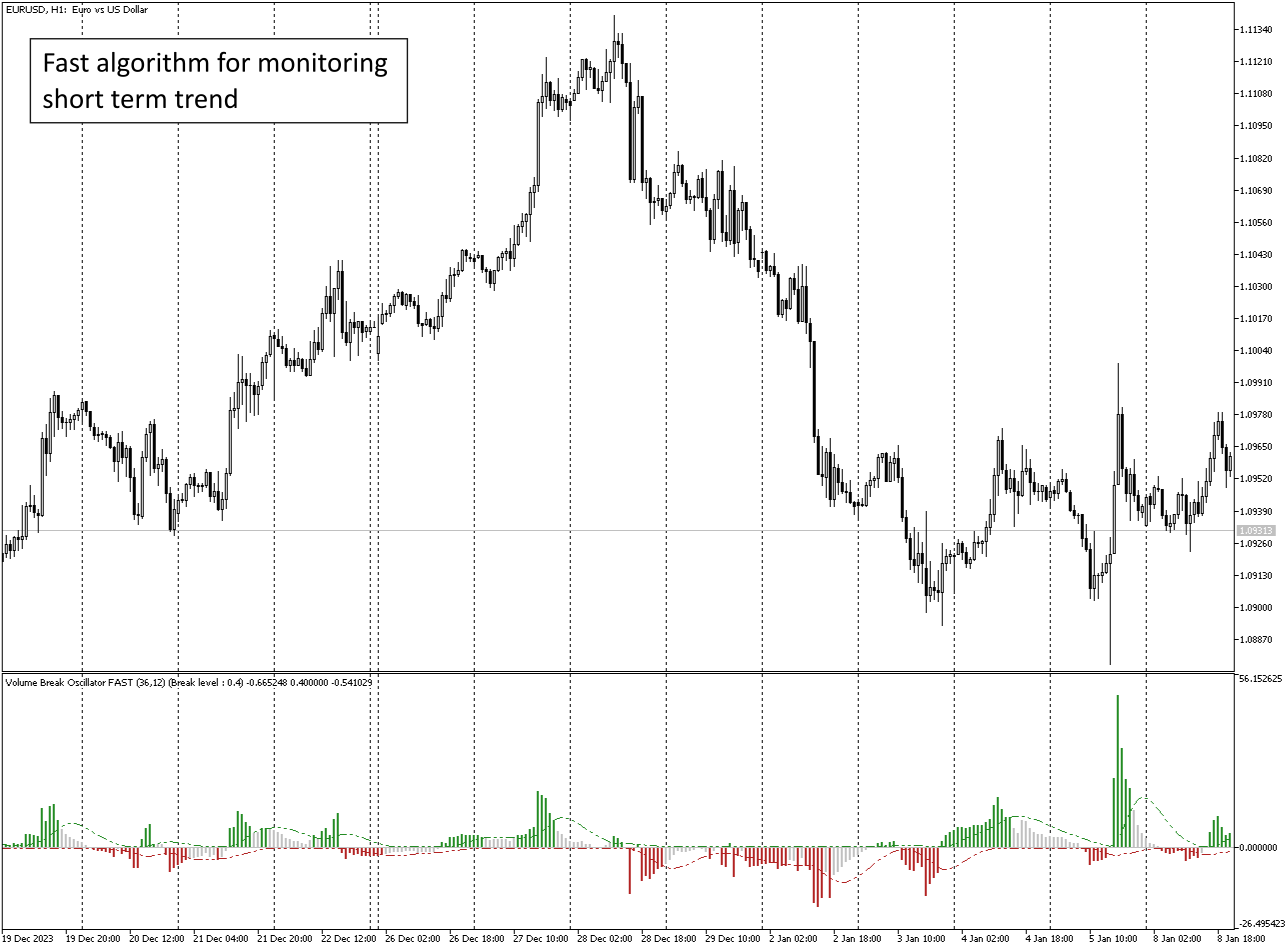
Berechnungstyp: SCHNELL, NORMAL, LANGSAM, zur Überwachung von kurzfristigen, mittleren und langfristigen Ereignissen, die im gleichen Zeitrahmen verbleiben.
Berechnungszeitraum: Berechnungszeitraum
Volumeneinstellungen:
Volumentyp: TickVolume (hauptsächlich für Forex) und RealVolume (für den Aktienmarkt)
Signaleinstellungen:
Signalzeitraum: Zeitraum der Signallinie
Bruchniveau: Schwellenwert für Ausbruchssignal
Alarmeinstellungen
Alarmtyp: Bei Schlussbalken oder sofortiger
Alarm
E-Mail
Benachrichtigung
Puffernummer zum Abrufen im EA:
0 - Histogramm
1 - Bruchlinie nach oben
2 - Bruchlinie nach unten
Viel Spaß beim Handeln!