Ma Speedometer Dashboard
- Indikatoren
- Davit Beridze
- Version: 1.0
- Aktivierungen: 5
Die Demoversion ist nutzlos. Du wirst nichts verstehen, wenn du die blinkenden Zahlen anschaust. Dies ist ein Dashboard. Versuche, das Konzept zu verstehen, und ich werde dir bei allem weiteren helfen.
Die Symbole müssen durch Kommas (,) getrennt und in die Parameter genau so eingegeben werden, wie sie von deinem Broker angezeigt werden, um sicherzustellen, dass sie im Dashboard erkannt werden. Diese Symbole werden für die Analyse durch den Indikator verwendet.
Mit einem Klick kannst du jedes Währungspaar und jeden Zeitrahmen direkt vom Dashboard aus öffnen.
Das MA Speedometer Dashboard ist ein sehr funktionaler Indikator für MetaTrader 4 (MT4), der entwickelt wurde, um Handelsstrategien durch dynamische Marktanalysen zu verbessern. Es bietet leistungsstarke Funktionen zur Erkennung von Markttrends, zum Handeln in Seitwärtsmärkten und zum Ausstieg aus flachen Marktbedingungen, alles basierend auf den Winkeln von gleitenden Durchschnitten. Als besonderes Bonusangebot erhalten die Kunden auch eine spezielle Version des MA Speedometer Indikators, der die Grundlage für das Dashboard bildet.
Hauptmerkmale:
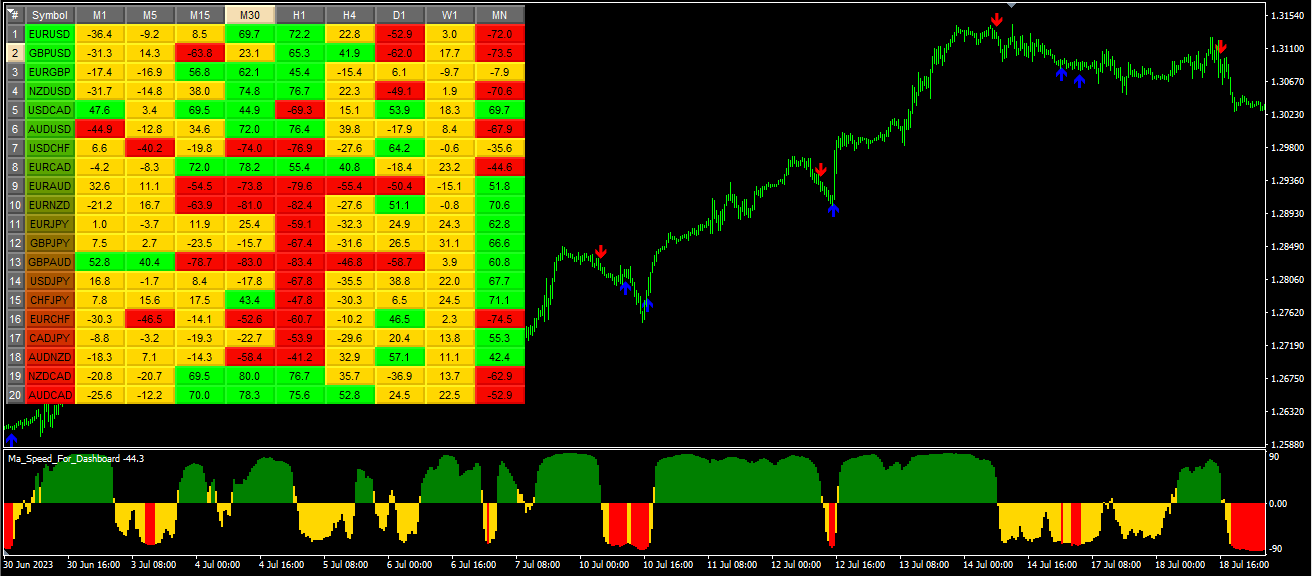
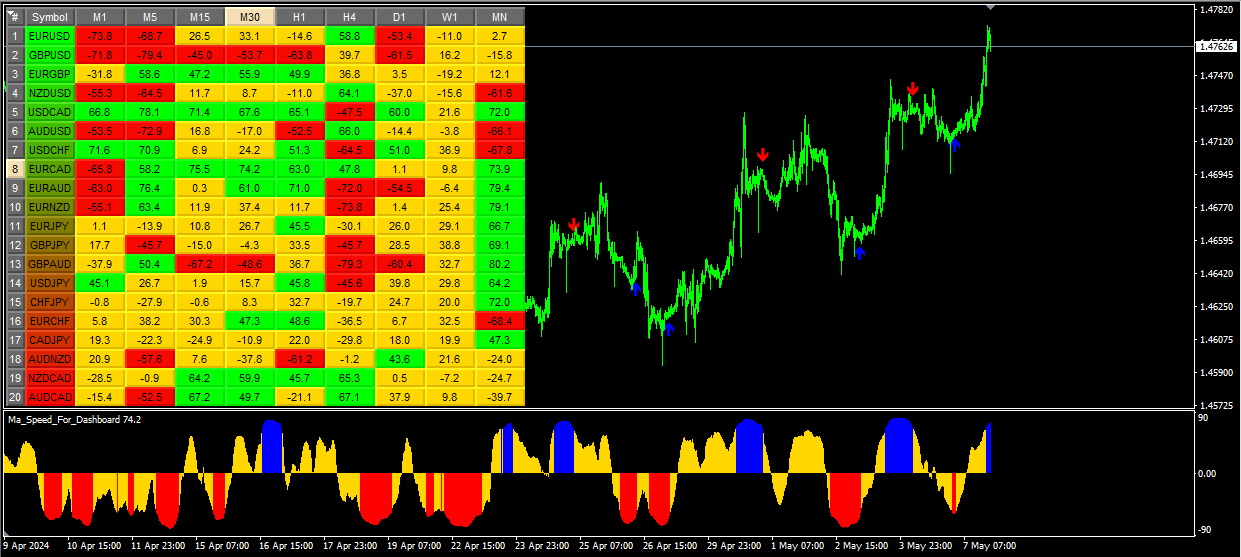
Marktanalyse: Das Dashboard verwendet die Winkel von gleitenden Durchschnitten (MA), um potenzielle Markttrends zu erkennen. Händler können durch farbkodierte Signale leicht den Beginn starker Auf- oder Abwärtstrends erkennen:
- Grün: Zeigt den Beginn eines starken Aufwärtstrends und bietet eine Einstiegsmöglichkeit.
- Rot: Zeigt den Beginn eines starken Abwärtstrends und bietet ebenfalls eine Einstiegsmöglichkeit.
- Gelb: Signalisiert flache oder seitwärts verlaufende Märkte und schlägt mögliche Ausstiegspunkte vor.
Multi-Zeitrahmen-Überwachung: Das Dashboard unterstützt mehrere Zeitrahmen, von M1 bis MN, sodass Händler die Marktbedingungen auf granularen und breiteren Ebenen analysieren können. Diese Funktion ist für verschiedene Handelsstile geeignet, einschließlich Day-Trading und längerfristiger Investitionen.
Interaktives Dashboard: Die interaktive Benutzeroberfläche ermöglicht es Händlern, schnell zwischen verschiedenen Währungspaaren und Zeitrahmen zu wechseln. Durch Klicken auf das Dashboard öffnet MT4 automatisch ein Diagramm für das ausgewählte Währungspaar und den Zeitrahmen, was die Benutzerfreundlichkeit und Effizienz erhöht.
Anpassbare Parameter: Händler können den Zeitraum, die Methode und die Schwellenwerte der Winkel der gleitenden Durchschnitte anpassen, um das Dashboard mit ihren bevorzugten Handelsstrategien in Einklang zu bringen. Diese Flexibilität macht das Tool anpassungsfähig an unterschiedliche Marktbedingungen und Handelsansätze.
Visuelle Warnungen: Das intuitive Design des Dashboards umfasst visuelle Warnungen und leicht lesbare Beschriftungen für verschiedene Marktbedingungen. Diese Funktion verbessert die Situationswahrnehmung und hilft den Händlern, schnell fundierte Entscheidungen zu treffen.
Bonusangebot: Als besonderes Angebot erhalten Kunden eine einzigartige Version des MA Speedometer Indikators. Dieser Indikator bildet die Grundlage für das Dashboard und ermöglicht eine noch detailliertere Analyse.
Beschreibung der einzelnen Eingabeparameter:
- Symbols: Dieser Parameter ist eine Zeichenketteneingabe, in der du eine Liste von Symbolen angeben kannst, die durch Kommas (,) getrennt sind. Diese Symbole werden vom Indikator zur Analyse verwendet.
- StartBar: Dieser Parameter ist eine ganzzahlige Eingabe, die die Startkerze für die Berechnung des Winkels des gleitenden Durchschnitts darstellt.
- MaPeriod: Dieser Parameter ist eine ganzzahlige Eingabe, die den Zeitraum für die Berechnung des gleitenden Durchschnitts darstellt.
- MaMethod: Dieser Parameter ist eine Auswahleingabe, die die Methode zur Berechnung des gleitenden Durchschnitts darstellt. Es kann Werte aus der ENUM_MA_METHOD-Auswahl annehmen, die wahrscheinlich Optionen wie den einfachen gleitenden Durchschnitt (SMA), den exponentiellen gleitenden Durchschnitt (EMA) usw. umfasst.
- Level_Up_M1 bis Level_Dn_MN1: Diese Parameter sind ganzzahlige Eingaben, die die oberen und unteren Ebenen für verschiedene Zeitrahmen (von M1 bis MN1) darstellen. Sie werden verwendet, um die Hintergrundfarbe der Schaltflächen basierend auf dem Winkel des gleitenden Durchschnitts zu bestimmen.
- X-Size und Y-Size: Diese Parameter sind ganzzahlige Eingaben, die die Breite und Höhe der Schaltflächen darstellen.
Zusammenfassung: Das MA Speedometer Dashboard bietet Händlern ein umfassendes Tool zur Marktanalyse, das sowohl für Trendhändler als auch für diejenigen geeignet ist, die Seitwärtsmärkte bevorzugen. Die Flexibilität, die interaktive Benutzeroberfläche und die anpassbaren Parameter machen es zu einer wertvollen Ergänzung für das Handelswerkzeugset, die hilft, die Komplexität des Forex-Marktes mit größerer Präzision und Einsicht zu meistern.


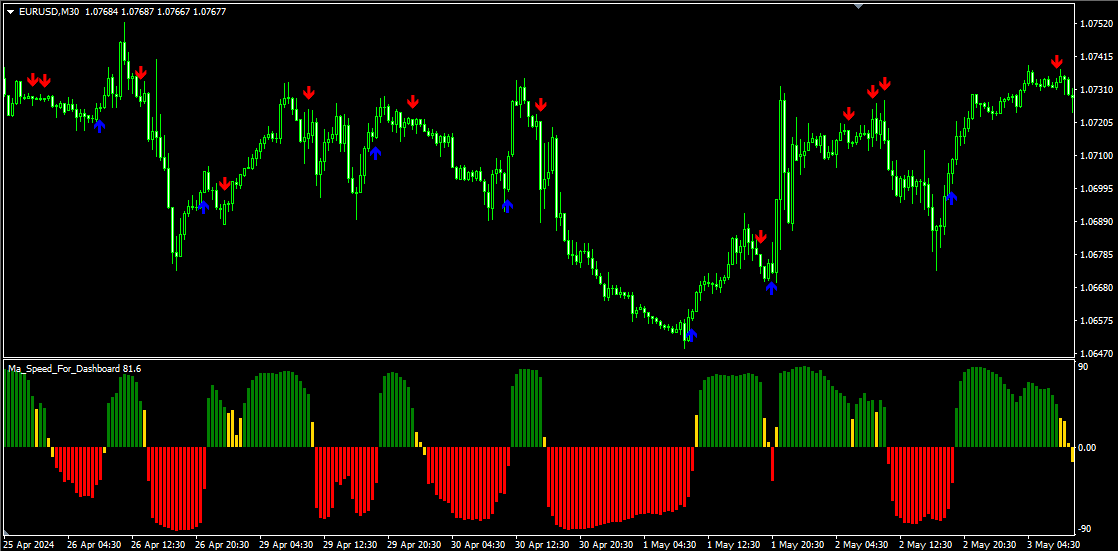


Great dashboard based on the innovative idea of MA angle changes on various instruments desired. The steeper the MA angle, the greater the momentum. Find the instruments with best momentum. Very clever idea. The bonus indicator is very helpful and gives great signals based on the same concept of MA angles, fully customizable.