• Übersicht
  • Bewertungen (5)
  • Diskussion (7)
  • Neue Funktionen

Enigmera

5
ENIGMERA: Der Kern des Marktes

Einführung
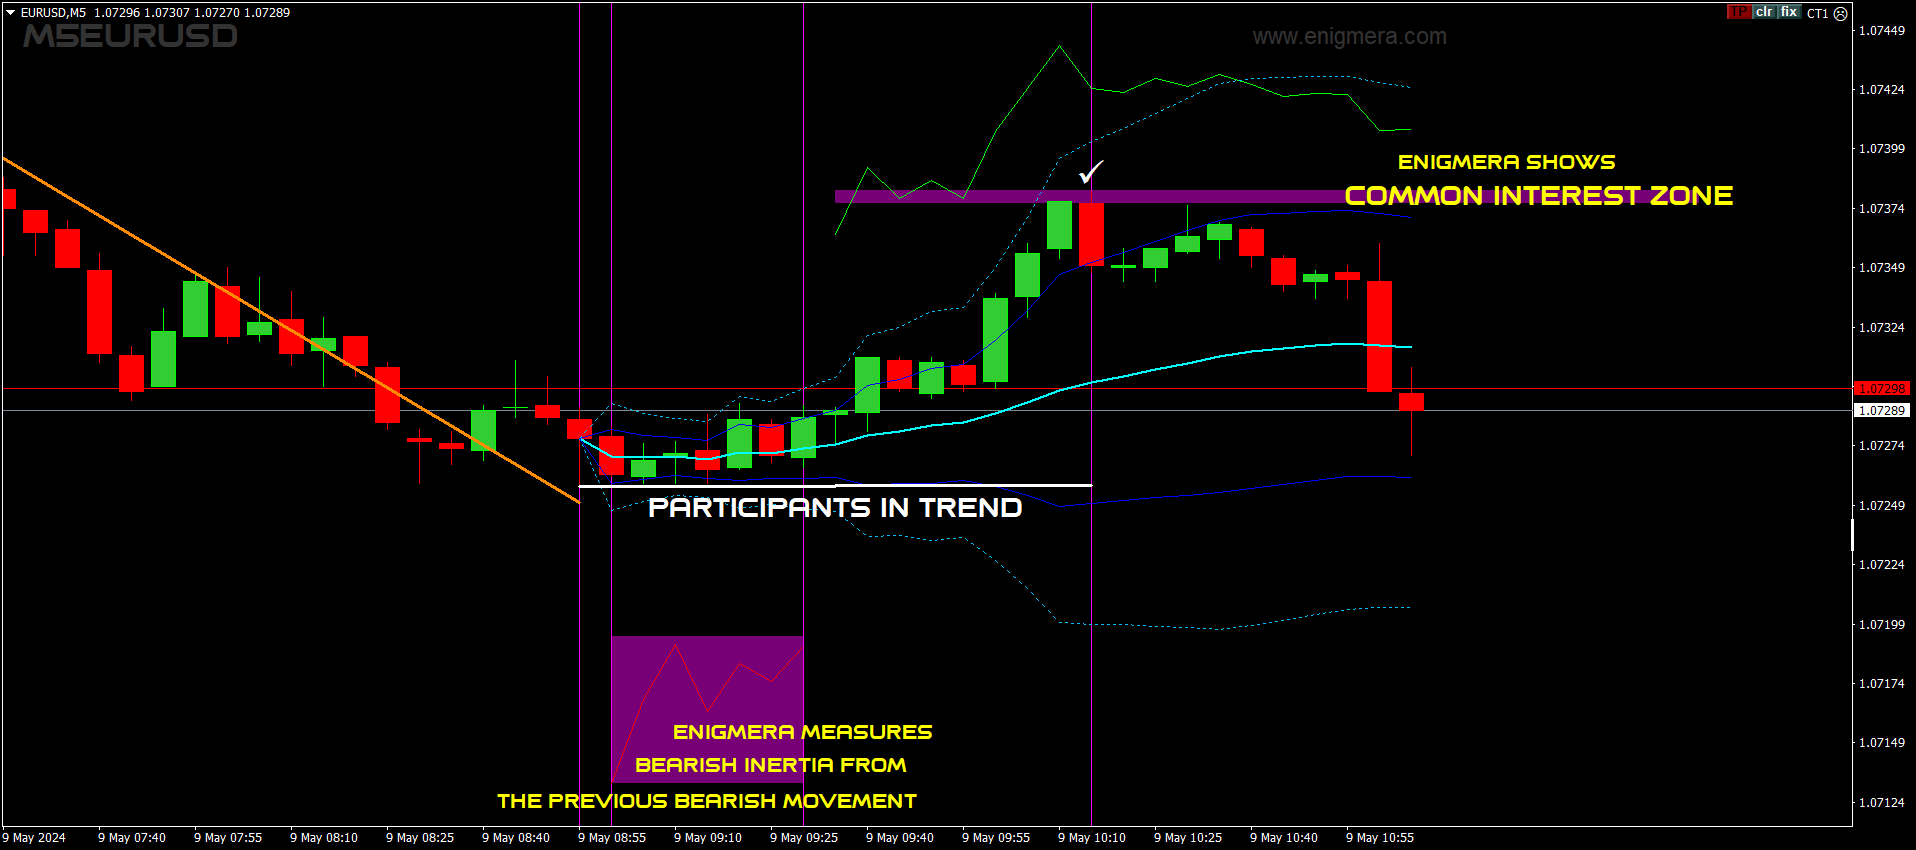
Dieser Indikator und dieses Handelssystem sind ein bemerkenswerter Ansatz für die Finanzmärkte. ENIGMERA nutzt die fraktalen Zyklen zur genauen Berechnung von Unterstützungs- und Widerstandsniveaus. Er zeigt die echte Akkumulationsphase an und gibt Richtung und Ziele vor.  Ein System, das funktioniert, egal ob wir uns in einem Trend oder in einer Korrektur befinden. 

Wie funktioniert es?
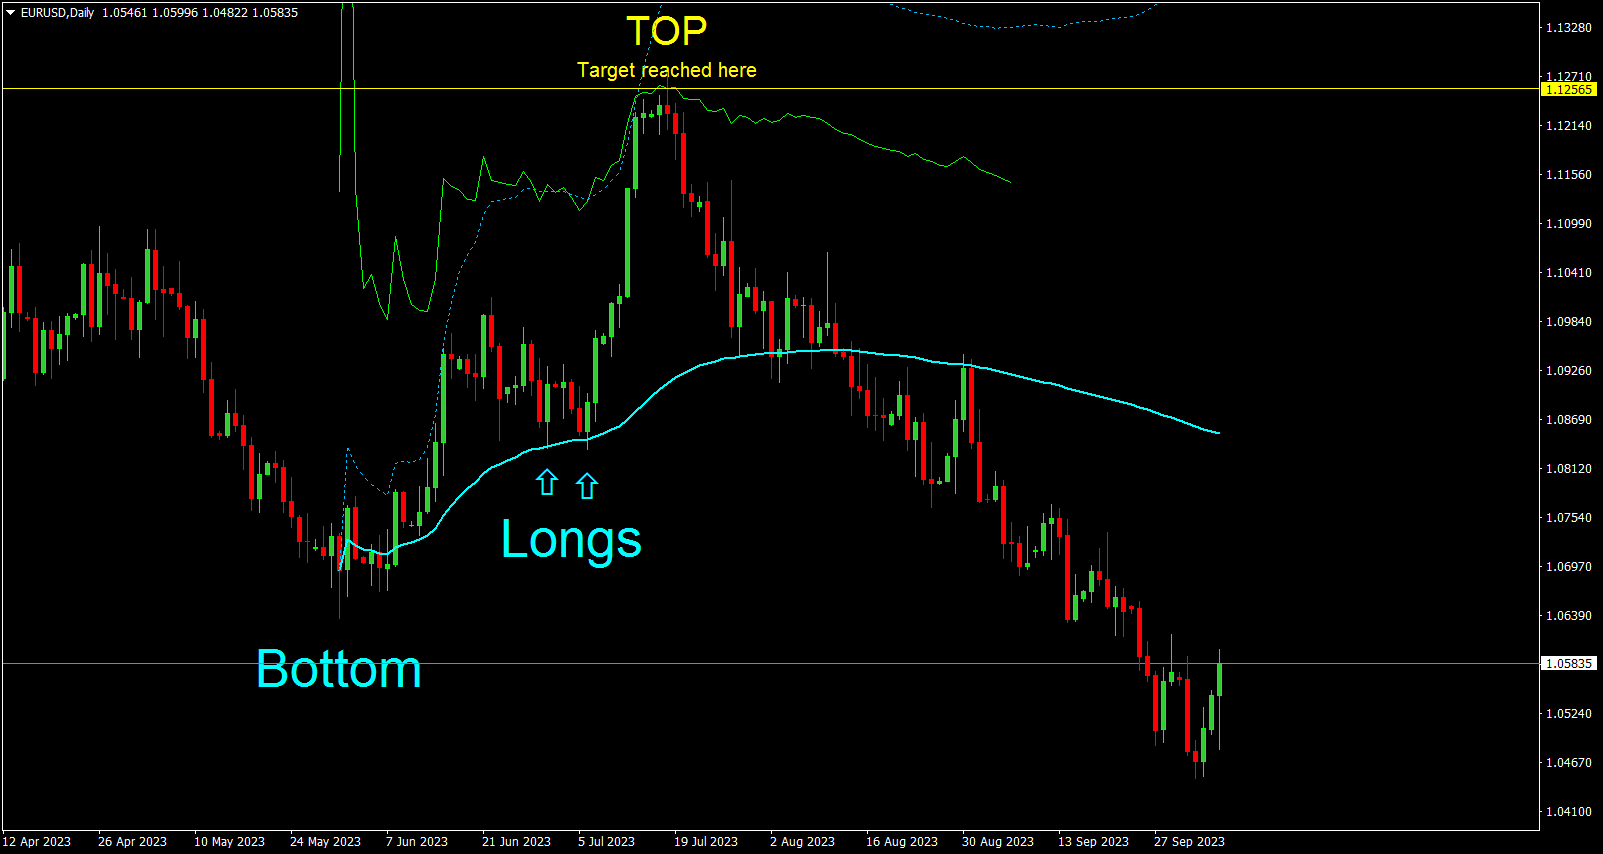
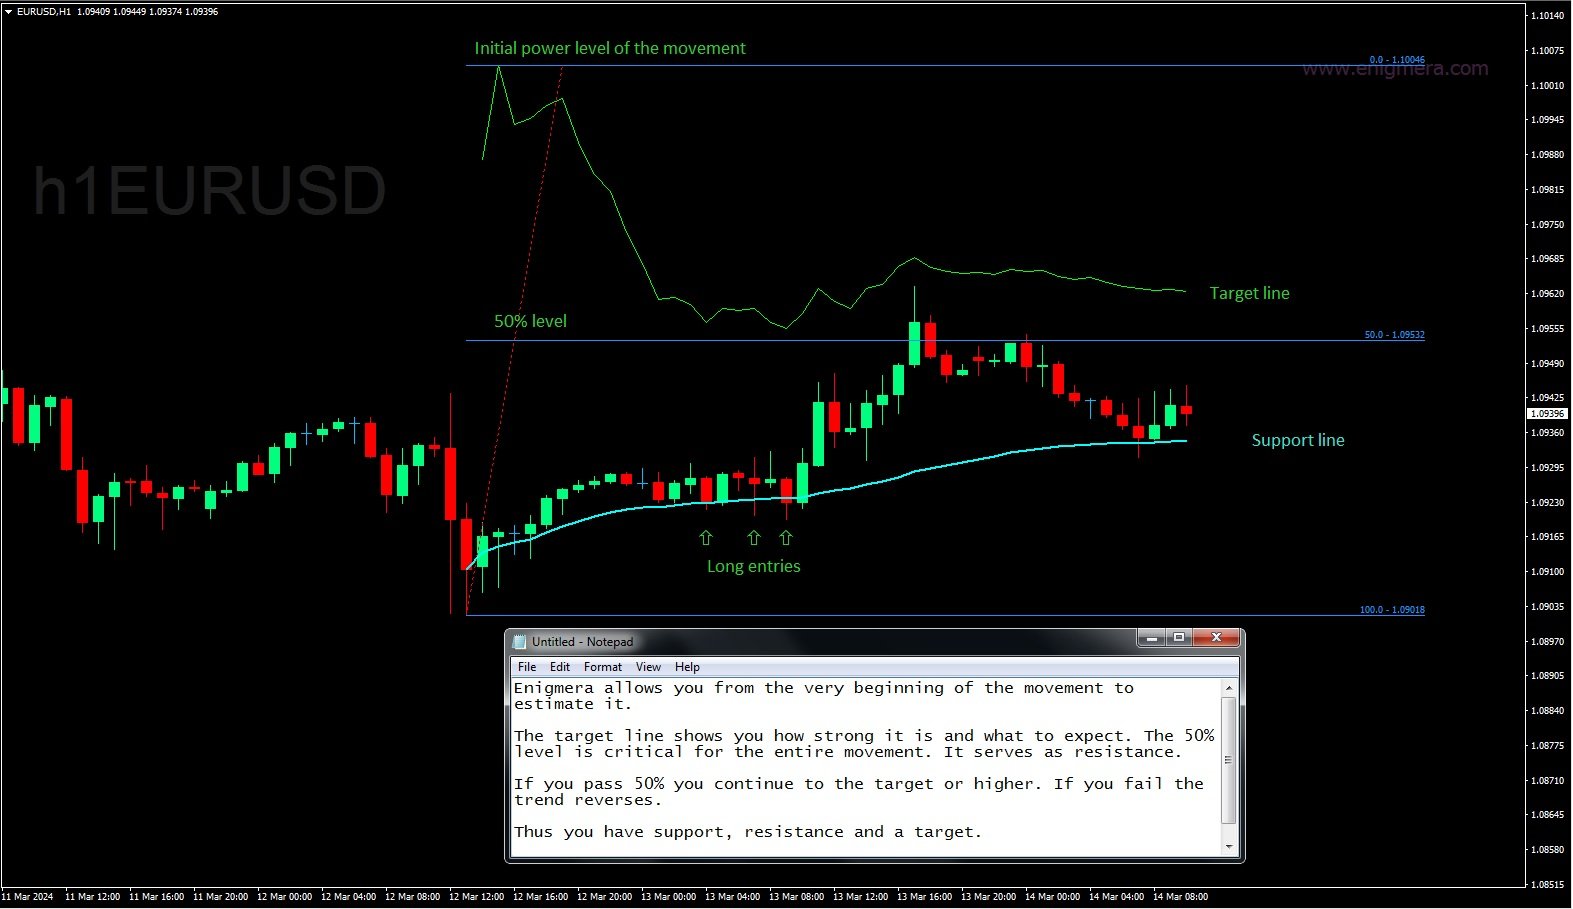
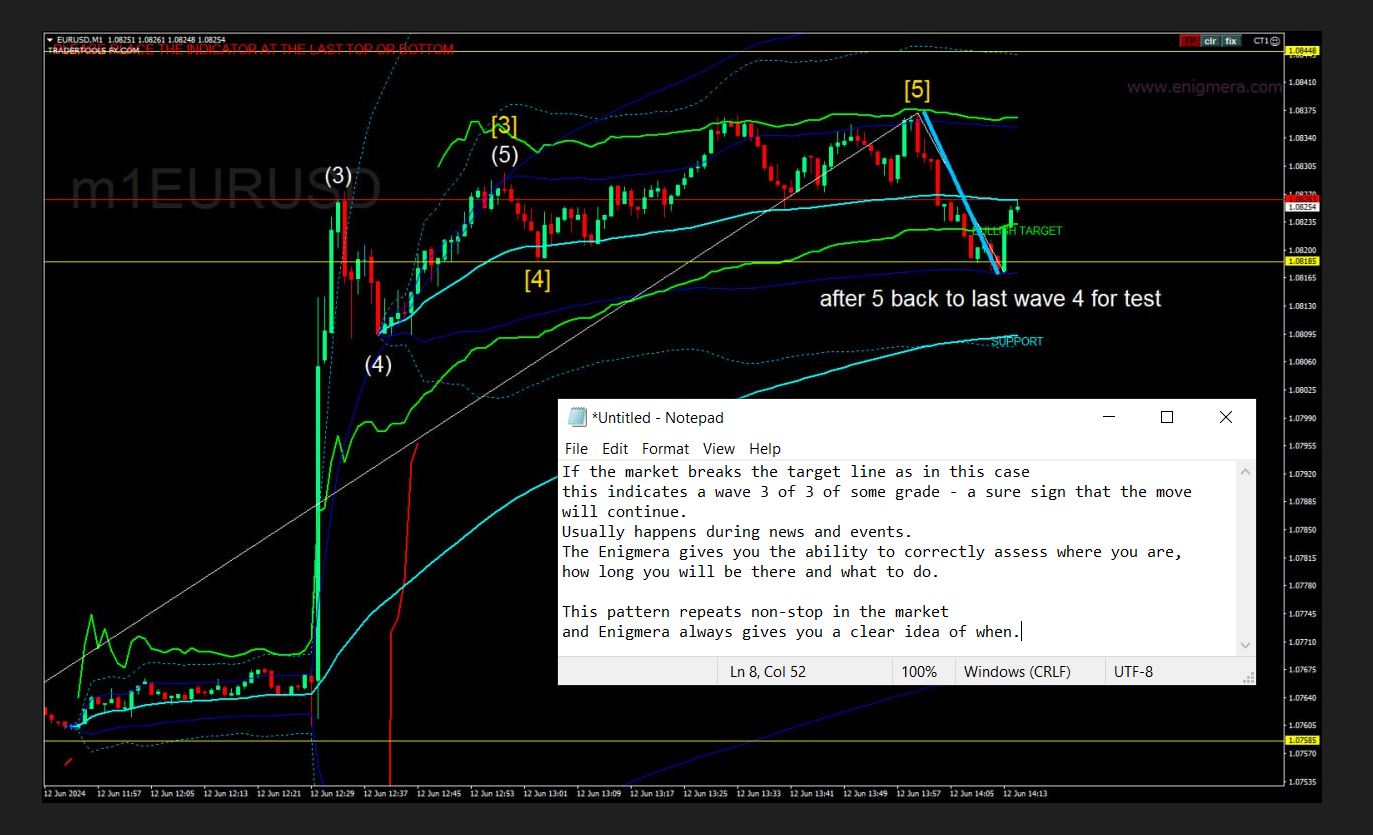
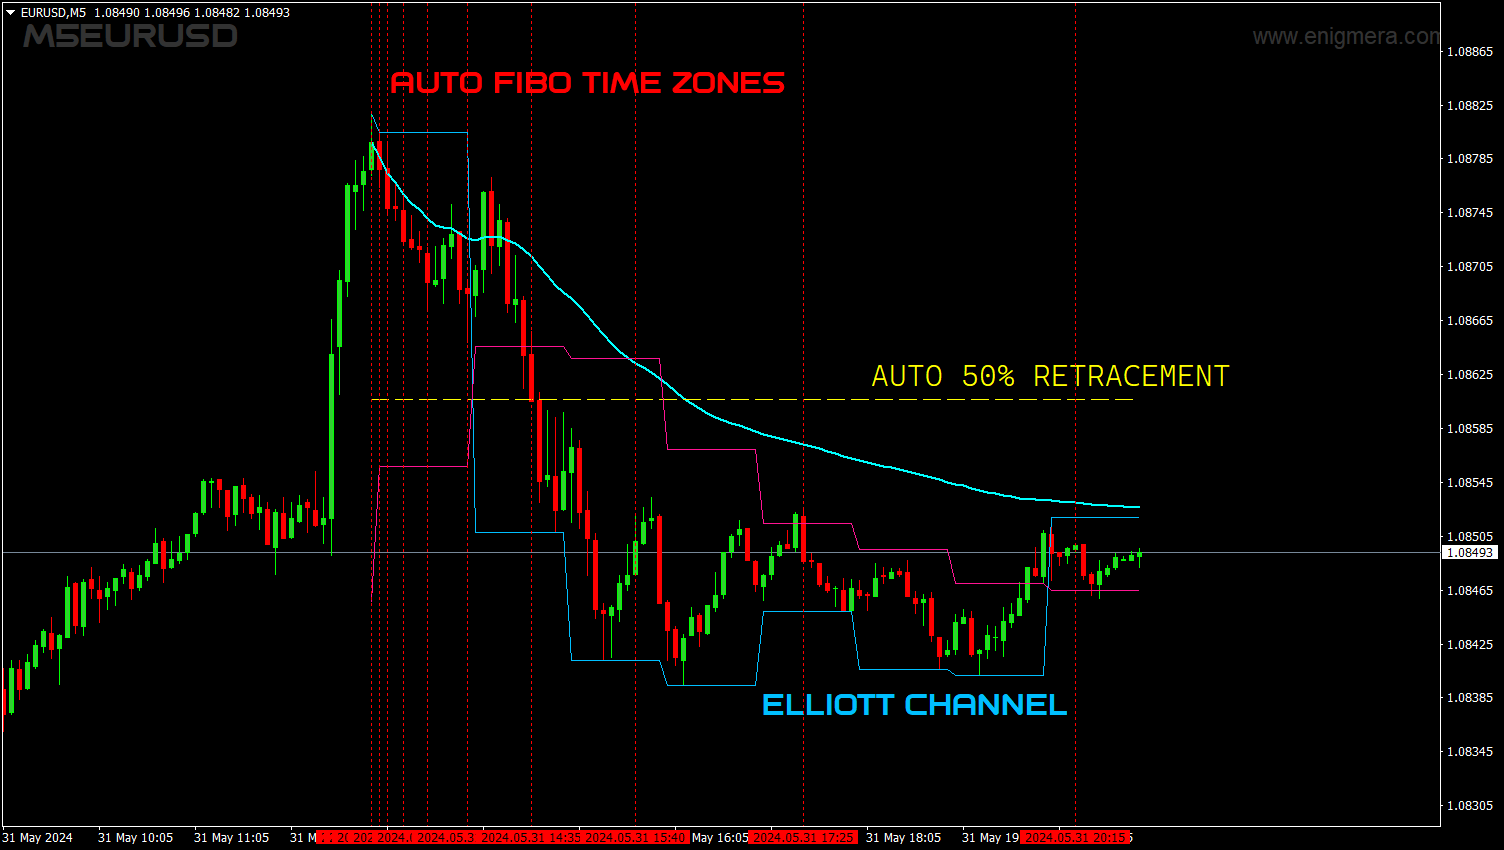
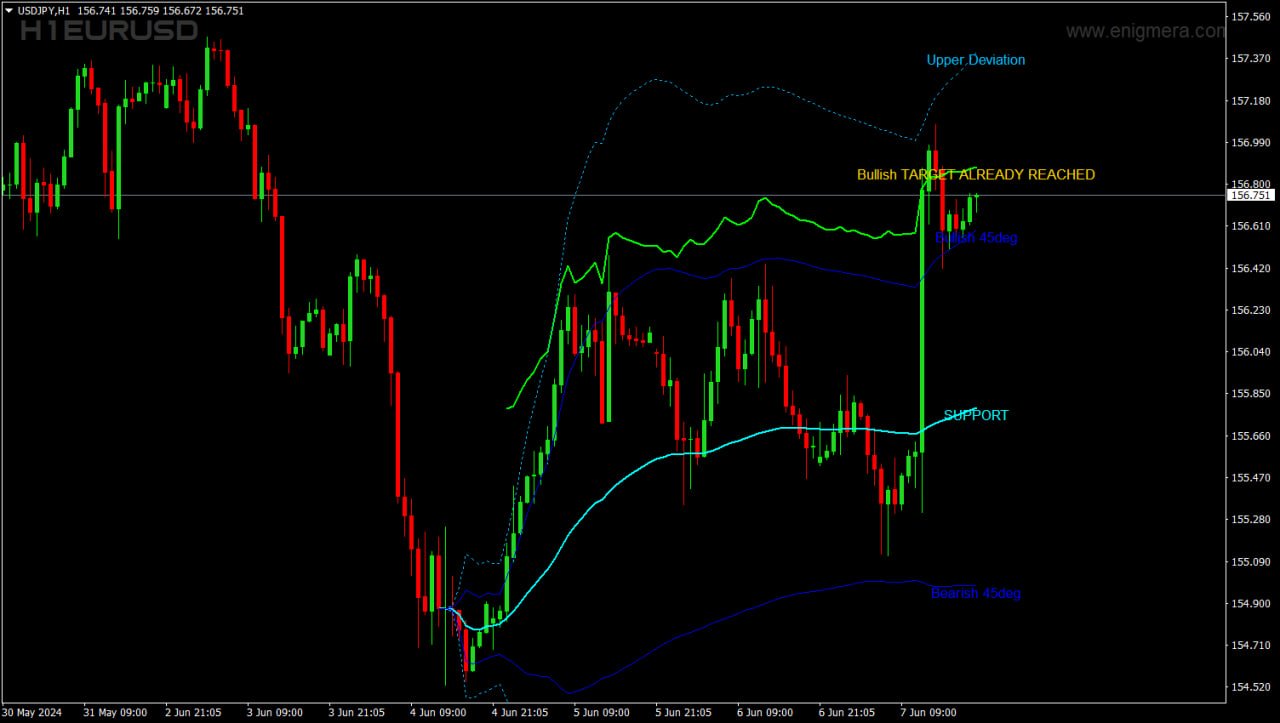
ENIGMERA besteht aus drei Linien: der Unterstützungs-/Widerstandslinie, der Ziellinie und der Abweichungslinie. Im Gegensatz zu typischen Marktindikatoren, die Daten aus der Vergangenheit in die Gegenwart und Zukunft extrapolieren, vermittelt das System ein vollständiges Bild der Gegenwart. Wenn Sie sich auf einer Unterstützung befinden, handelt es sich um eine echte Unterstützung, und wenn Sie sich auf einem Widerstand befinden, handelt es sich um einen echten Widerstand. Wenn ein Niveau durchbrochen wird, deutet dies auf eine Trendänderung hin. Keine Neueinzeichnung.

Da sich der Markt ständig weiterentwickelt, passt ENIGMERA seine Bewertungsinstrumente an und modifiziert seine Strategien regelmäßig.  
So ist gewährleistet, dass jedes Szenario gründlich bewertet wird. Die Einzigartigkeit dieses Marktindikators ist offensichtlich, seine Fähigkeiten sind offensichtlich.  

ENIGMERA richtet sich an Finanzanalysten und Berater, die zuverlässige Erkenntnisse für ihre Kunden benötigen, sowie an Investoren, die ein Höchstmaß an Präzision und Sicherheit erwarten. 
Das System zeichnet sich durch seine Fähigkeit aus, eine optimale Präzision zu erreichen, die es den Händlern ermöglicht, ihre Optionen selbstbewusst und klar zu bewerten.

ENIGMERA vereint 20 Jahre Handelserfahrung und Wissen in einem umfassenden Paket.

Intuitiv und doch benutzerabhängig 

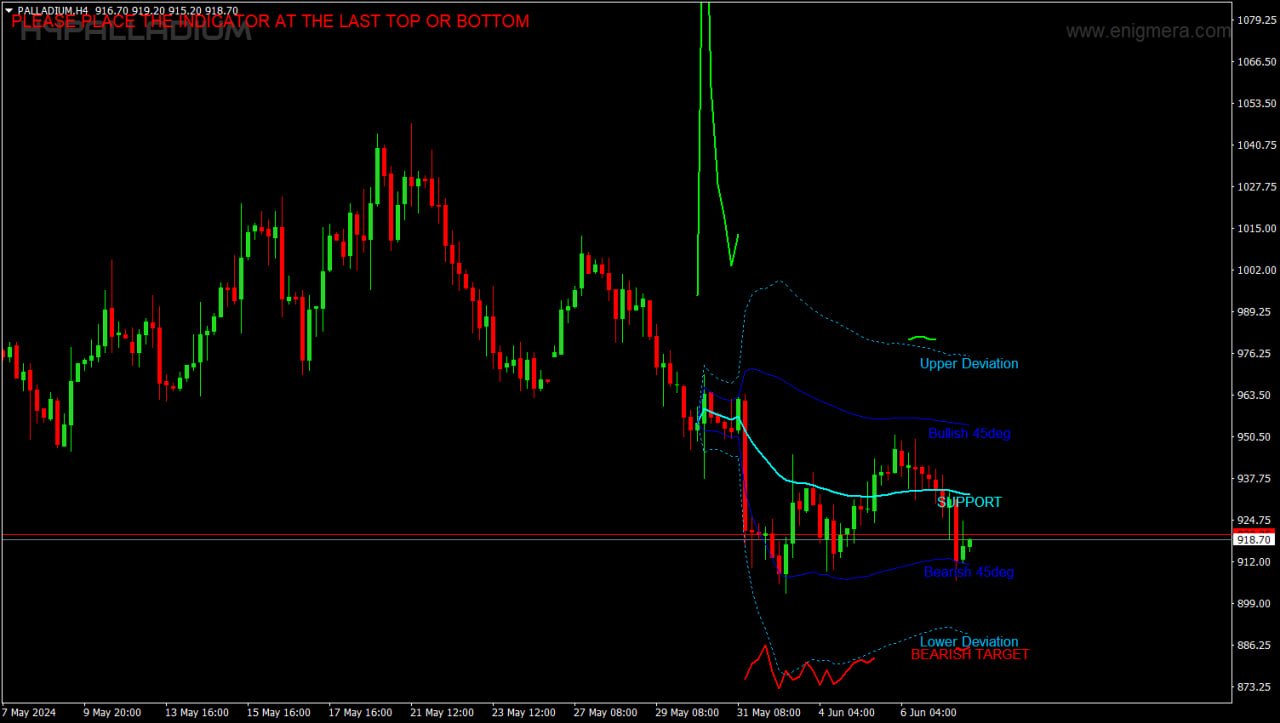
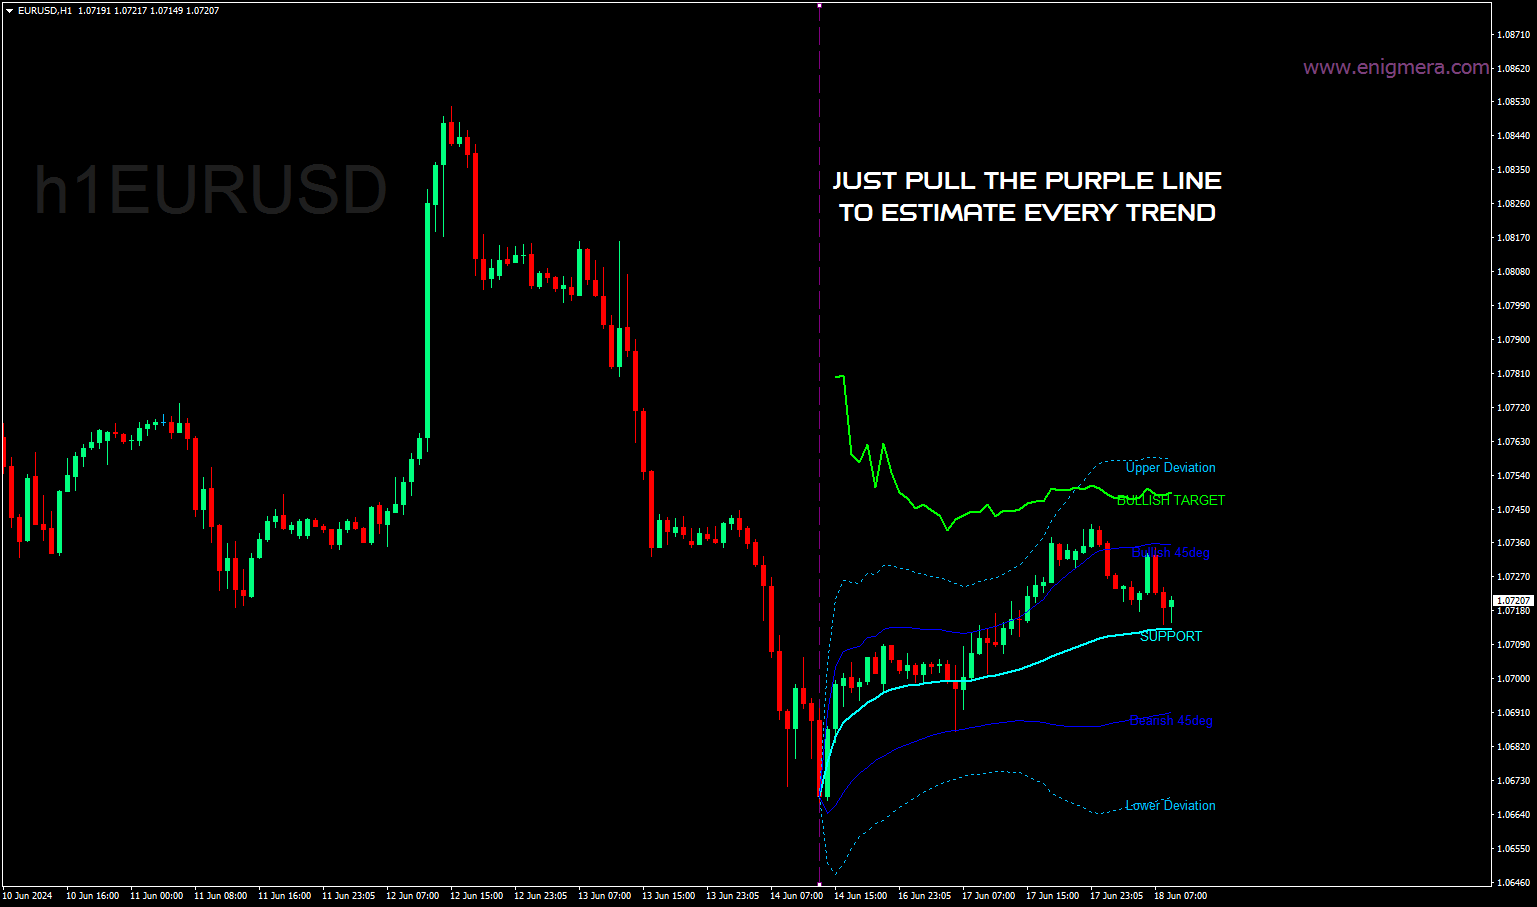
Die Wirksamkeit von ENIGMERA hängt von der korrekten Konfiguration durch den Benutzer ab. Ungenaue Einstellungen können die Präzision der Analyse beeinträchtigen. Es ist wichtig, dass die Benutzer die Funktionen des Systems genau verstehen, um seine Leistung zu maximieren.

Zusammenfassend lässt sich sagen, dass ENIGMERA nicht nur die Finanzanalyse verbessert, sondern auch mühelos durch alle Dimensionen der Analyse navigiert. Präzision, Agilität und Reaktionsfähigkeit in Echtzeit sind von größter Bedeutung. Mit ENIGMERA werden Sie die Märkte nicht einfach nur beobachten, sondern sie vollständig verstehen und analysieren. Dieses Verständnis führt zu effektivem Handeln.

Sind Sie bereit, Ihre finanzielle Entscheidungsfindung auf die nächste Stufe zu heben?
Bewertungen 5
vincenzo1964
913
vincenzo1964 2024.07.11 15:59 
 

Assolutamente straordinario a cominciare da chi l'ha ideato Ivan, Sono assolutamete felice dell'affito/prova fatto, Enigmera è sorprendente, ti accompagna sempre sul lato giusto della tendenza sino alla fine del percorso. Se poi parliamo del dott. Ivan e della sua disponbilità, se potessi postare gli screenshot e la guida passo passo che mi ha concesso, è commovente e sorprendente. Se volete fare buon trading con giudizio e responsabilità potete tranquillamente perdere qualche giorno del vostro tempo a capire la logica ed il ragionamento che c'è dietro enigmera, solo così sarete sempre dal lato giusto del trend sino alla fine, sopratutto quando ci sono le news ed enigmera già vi sta indicando i livelli di tp da raggiungere. Proprio oggi ero già lon su eurusd e sell su usdchf ed entrambe dopo le notizie chiuse in tp. Consiglio anche l'indicatore Speed, leggetene l'utilizzo, la forza e ciò che vi può indicare, io ci sto lavorando sodo seguito da ivan perchè l'unione di enigmera e speed è devastante, alla fine dell'affitto acquisterò engmera mentre affitterò mensilmente speed (il costo è di 30.00€ mentre l'acquisto è di 3000€), ma il suo potenziale per il trend followhing e immenso, saluti e buon trading a tutti, grazie Ivan...

Sajid Iqubal
97
Sajid Iqubal 2024.06.08 21:59 
 

Enigmera is an exceptional trading indicator that has greatly improved my trading performance. Ivan Stefano offers the best support and guidance, always going above and beyond like an elder brother to me. His guidance and the effectiveness of Enigmera make a winning combination. I highly recommend using Enigmera.

ebel
1191
ebel 2023.11.22 14:41 
 

This indicator is undoubtedly expensive but I believe it to be the Ferrari of indicators and the only one you will ever need. The video in the overview is self explanatory, take the time to find the setups as described and the R:R can be extremely good. I have only been using the indicator for a week but have found several very profitable trades and feel confident that I can make back more than sufficient each month to cover my 6 monthly rental. The author is extremely responsive and helpful and is starting a telegram group so that we can share prospective setups. I believe the indicator is difficult to get to work in Strategy Tester but the author is open to free trials which demonstrates his trust in the product. I can't post images here but I will post a trade I made this morning in the comments. I can't promise it is the perfect setup as I am still learning but just this one trade covered my monthly rental cost. IMPORTANT - do not try to change to a lower timeframe while the indicator is loaded. The code is incredibly complex and trying to recalculate everything on a lower tf over a significant period will freeze your MT4 installation. You will need to delete the indicator from your MT4, force a shut down, restart and re-install. Once you understand the complexity it is not a problem, just open another chart on a lower tf or delete the indicator, change the tf and put it back on.

UPDATE 23/11

I have just seen that the author has been debarred from selling! I have just paid for 6 months rental and this is a good indicator that is making me money. What to I do after 6 months if I can't renew? And why has this happened, the author is very courteous and helpful.

Empfohlene Produkte
This is an arrow indicator without a future function,developed based on the most advanced profit trading algorithms.It has the most innovative and advanced dual trend analysis module, as well as the latest and highly effective market trend prediction algorithm.Trends are your friends, and following larger trends can earn the maximum profit in foreign exchange. This indicator helps traders identify current trends and track them. Someone once made a profit of 10 times in a week by relying on it.No
Scalper-Roboter für den Zeitrahmen M5. Handelt mit dem Währungspaar GBPUSD. Dieser Roboter wurde von einem Unternehmen professioneller Händler speziell für den Handel mit Pfund Sterling entwickelt. Der Roboter eröffnet täglich etwa 5 bis 15 Trades. Es ist am besten, mit Brokern zu handeln, die einen niedrigen Spread auf GBPUSD von bis zu 10 Pips haben. Die empfohlene Mindesteinzahlung zu Beginn beträgt 500 $ oder mehr. Vorteile: verwendet kein Martingal. kein Netz. Jeder Trade hat einen Stop-
Attention, for the indicator to work correctly, you need to put the "MQL5" folder in your terminal folder, you can download it from the link below: https://disk.yandex.ru/d/DPyo0ntaevi_2A One of the best arrow indicators for Binary Options, which can also be used in the Forex market. Any time frame from M1 to MN, any currency pair, can also be used on stocks - the indicator is universal. Expiration from 1 to 5 candles. Displays traffic statistics on a graph. The indicator gives signals along t
Trend Flasher Trend is your friend is the age old saying quote in trading arena, there are though many ways to gauge the trend and its direction, more scientific measure and logically meaningful will be an ATR break outs to identify and spot the trend and its acceleration, so we created this easy to use trend identification panel and optimized super trend based multi time frame panel entry system to aid and help the traders to make their trading decision. Unique Features of Trend Flasher 1
The Penta-O is a 6-point retracement harmonacci pattern which usually precedes big market movements. Penta-O patterns can expand and repaint quite a bit. To make things easier this indicator implements a twist: it waits for a donchian breakout in the right direction before signaling the trade. The end result is an otherwise repainting indicator with a very reliable trading signal. The donchian breakout period is entered as an input. [ Installation Guide | Update Guide | Troubleshooting | FAQ | A
PABT Pattern Indicator - it's classical system one of the signal patterns. Indicator logic - the Hi & Lo of the bar is fully within the range of the preceding bar, look to trade them as pullback in trend. In the way if indicator found PABT pattern it's drawing two lines and arrow what showing trend way.  - First line - it's entry point and drawing at: 1. On the high of signal bar or on middle of the signal bar (depending from indicator mode) for buy; 2. On the low of signal bar or on middle of t
Night ghost
Dmitriy Kashevich
Night Ghost - Pfeilanzeige für binäre Optionen. Dies ist ein zuverlässiger Assistent für Sie in der Zukunft! - Kein Neuzeichnen auf dem Diagramm -Funktioniert hervorragend bei allen Währungspaaren! - Anzeigegenauigkeit bis zu 90 % (besonders nachts) -Keine lange Einrichtung erforderlich (perfekt für binäre Optionen eingerichtet) - Keine späten Signale - Das Erscheinen eines Signals auf der aktuellen Kerze -Perfekt für die M1-Periode (nicht mehr!) - Augenfreundliche Kerzenfar
Black series MT4
Dmitriy Kashevich
1 (1)
Black series MT4 - The indicator is designed for trading on binary options with Timeframe M1-M5-M15 Multicurrency (Works on cryptocurrency and currency pairs) The signal appears when the candle opens Up to 90% correct signals There is no signal redrawing at all Can be used with other indicators. Good for scalping! In Settings there is: -Indicator working methods -I Allert Arrow color Red signal down Blue signal up Also watch the video how the indicator works and signals
Elliott Wave Trend was designed for the scientific wave counting. This tool focuses to get rid of the vagueness of the classic Elliott Wave Counting using the guideline from the template and pattern approach. In doing so, firstly Elliott Wave Trend offers the template for your wave counting. Secondly, it offers Wave Structural Score to assist to identify accurate wave formation. It offers both impulse wave Structural Score and corrective wave Structure Score. Structural Score is the rating to sh
VR Cub
Vladimir Pastushak
VR Cub ist ein Indikator für den Erhalt hochwertiger Einstiegspunkte. Der Indikator wurde entwickelt, um mathematische Berechnungen zu erleichtern und die Suche nach Einstiegspunkten in eine Position zu vereinfachen. Die Handelsstrategie, für die der Indikator geschrieben wurde, hat sich seit vielen Jahren bewährt. Ihr großer Vorteil liegt in der Einfachheit der Handelsstrategie, die es auch unerfahrenen Händlern ermöglicht, erfolgreich damit zu handeln. VR Cub berechnet Positionseröffnungspunkt
Binary Options Support Resistance Indicator This indicator is designed for binary options trading and effectively shows retracements from support and resistance levels. Signals appear on the current candle. A red arrow pointing downwards indicates a potential selling opportunity, while a blue arrow pointing upwards suggests buying opportunities. All that needs adjustment is the color of the signal arrows. It is recommended to use it on the M1-M5 timeframes as signals are frequent on these timef
The main idea of this indicator is rates analysis and prediction by Fourier transform. Indicator decomposes exchange rates into main harmonics and calculates their product in future. You may use the indicator as a standalone product, but for better prediction accuracy there is another related indicator - FreqoMaster - which uses FreqoMeterForecast as a backend engine and combines several instances of FreqoMeterForecast for different frequency bands. Parameters: iPeriod - number of bars in the ma
MT My Way
Issara Seeboonrueang
Best strategy,  Easy trade ,  Support of version update in the future MT My Way:  For new traders with no experience It is a very simple trade. Open the order when there is signal and close the order when there is exit or found the next opposite signal. You can set Stop Loss at the arrow and set the distance at Arrow Gap. For experienced traders, It will be very easy to trade. indicator for trade by yourself TRADE: Forex  TIME FRAME:  All Time Frame (Not M1) SYMBOL PAIR: All Sy
Gold Phoenix
Yaroslav Varankin
The perfect tool for Scalng in the Forex markets You can trade both from signal to signal and using take profit  The algorithm does not use Zigzag!  No redrawing!  This is a channel instrument that uses a moving average as a filter. Moving Average  There are 2 parameters for the settings Ma Period = 5 period Moving Average  Channel 1.0 distance of channel lines from the chart Price Signal Filter - calculation of signal opening and filter There is a complete set of Alert There is a multi-timefram
WanaScalper MT4
Isaac Wanasolo
1 (1)
A scalping indicator based on mathematical patterns, which on average gives signals with relatively small SL, and also occasionally helps to catch big moves in the markets (more information in the video) This indicator has three main types of notifications: The first type warns of a possible/upcoming signal on the next bar The second type indicates the presence of a ready signal to enter the market/open a position The third type is for SL and TP levels - you will be notified every time price r
Fourteen plus nine TD Sequential
MOHAMMED IMAD HUSSEIN BASSEE
Fourteen plus nine What is it for? Applying Tom DeMark’s TD Sequential serves the purpose of identifying a price point where an uptrend or a downtrend exhausts itself and reverses. . What are the main components of TD Sequential? TD Sequential has two parts – TD Setup and TD Countdown. The first phase of TD Sequential starts with a TD Setup and is completed with a 9 count. When the 9 count is completed, it is at that point, a price pause, price pullback, or reversal is likely. It is also at tha
Smooth price for Monarch MT4
Konstantin Gruzdev
3.67 (3)
The Smooth Price technical indicator is used for plotting a smoothed line as close to the price of the financial instrument as possible, and serves to eliminate its noise components. The indicator is part of the Monarch trading system, but here it is presented as an independent technical analysis tool. The indicator is based on the cluster digital filter , which, unlike the ClusterSMA , is applied directly to the price time series. Smooth Price does not redraw (except the very last, zero bar) an
Trend lines master
The Trading Team Ltd
5 (1)
Launch promotion For a limited time only:  30$ instead of 157$ Summary Create precise trend lines in a second Description This indicator will draw your trend lines automatically with great precision, saving you some precious time. It uses Bill Williams Fractals to identify the key points and draws both inner and outer trend lines. Features Automatically draws precise trend lines
Trend Ray
Andriy Sydoruk
The indicator shows the potential trend direction by cyclical-wave dependence. Thus, all the rays of the intersection will be optimal rays, in the direction of which the price is expected to move, taking into account the indicator period. Rays can be used as a direction for potential market movement. But we must not forget that the approach must be comprehensive, the indicator signals require additional information to enter the market.
This indicator is, without a doubt, the best variation of the Gann Angles among others. It allows traders using Gann methods to automatically calculate the Gann angles for the traded instrument. The scale is automatically calculated when the indicator is attached to the chart. When switching timeframes, the indicator recalculates the scale for the current timeframe. Additionally, you can enter your own scales for the Gann angles. You can enter your own scales either for both vectors or for each
Advanced Trend Regime
Shellard Securities (Pty) Ltd
The indicator has been designed to function on any time-frame and any pair.   This regime filter will help the trader better evaluate whether the current market is trending, and in which direction. It quickly reacts to changes in market dynamics using a series of advanced calculations. The user is able to select whether the calculation remains standard, or if a further filter constraint is added to the calculation.   A Yellow moving average of the signal has been included for the trader to smoot
Renko, Heiken Ashi, Ticks Bar, Range Bar.    Easy switching, easy setup, all in one window.        Place the Custom Chart indicator and view Renko, Heiken Ashi, Tick bar, Range bar charts in real time at real chart.    Position the offline chart window so that the indicator control panel is visible.    Switch the chart mode by click of a button.    Connect to the output chart any indicator, expert advisor without any restrictions.    No, it doesn't work in the tester.    Yes, you can use an
Trend PA
Mikhail Nazarenko
5 (3)
The Trend PA indicator uses   Price Action   and its own filtering algorithm to determine the trend. This approach helps to accurately determine entry points and the current trend on any timeframe. The indicator uses its own algorithm for analyzing price changes and Price Action. Which gives you the advantage of recognizing, without delay, a new nascent trend with fewer false positives. Trend filtering conditions can be selected in the settings individually for your trading style. The indicator
EA Black Box
Vitali Vasilenka
EA Black Box Expert Advisor ist seiner Zeit bereits voraus! - ein Handelsalgorithmus, der wichtige harmonische Muster enthält Hat harmonische Muster: Bullish_5-0_Pattern Bearish_5-0_Pattern Bearish_Three_Drives Bullish_Three_Drives Telegram-Kanal unserer Community – https://t.me/EAQuantumLab Offizielle Community-Site – https://eaquantumlab.com Echte Signale sind hier verfügbar: https://www.mql5.com/en/users/vitalvasa/seller Mindesteinzahlung für den Handel 1000$ Verwenden Sie Konten mit
The indicator detects and displays Shark harmonic pattern (see the screenshot). The pattern is plotted by the extreme values of the ZigZag indicator (included in the resources, no need to install). After detecting the pattern, the indicator notifies of that by a pop-up window, a mobile notification and an email. The indicator highlights the process of the pattern formation and not just the complete pattern. In the former case, it is displayed in the contour triangles. After the pattern is comple
Atomic Analyst
Issam Kassas
5 (2)
Zunächst einmal ist es erwähnenswert, dass dieser Handelsindikator nicht neu malt, nicht neu zeichnet und keine Verzögerung aufweist, was ihn sowohl für manuellen als auch für Roboterhandel ideal macht. Benutzerhandbuch: Einstellungen, Eingaben und Strategie. Der Atom-Analyst ist ein PA-Preisaktionsindikator, der die Stärke und das Momentum des Preises nutzt, um einen besseren Vorteil auf dem Markt zu finden. Ausgestattet mit fortschrittlichen Filtern, die helfen, Rauschen und falsche Signale z
Chart Patterns Detect 15 patterns (Ascending Triangle, Descending Triangle, Rising Wedge, Falling Wedge, Bullish Flag, Bearish Flag, Bullish Rectangle, Bearish Rectangle Symmetrical triangle, Head and Shoulders, Inverted Head and Shoulders, Triple top, Triple Bottom, Double Top, Double Bottom) Use historical data to calculate the probability of each pattern to succeed (possibility to filter notification according to the chance of success) gives graphic indication about the invalidation level and
Fibonacci indicator based on fractal.This software can automatically draw the golden section proportional line of two trend lines, and mark all the recent high and low prices.And the percentage value of volatility is a multi-cycle, multi-currency oscillation indicator.It is very effective for traders to find support and resistance lines and find entry and exit points near them.
POWR Rise Coming
Trade Indicators LLC
This indicator is SO SIMPLE… when the green Rise Coming arrow appears, a price drop may be on the way! Plain and easy profits! As you receive more than one 'Rise Coming' text signal in a downtrend, it means momentum is building larger for a bull run. HOW TO USE 1. When the green "Rise Coming" text appears, a price jump may be on the way! This indicator Never Repaints! To get the best setting it's a matter of tweaking the indicator until it gives you the best results. Our recommendation, and what
How to use Pair Trading Station Pair Trading Station is recommended for H1 time frame and you can use it for any currency pairs. To generate buy and sell signal, follow few steps below to apply Pair Trading Station to your MetaTrader terminal. When you load Pair Trading Station on your chart, Pair Trading station will assess available historical data in your MetaTrader platforms for each currency pair. On your chart, the amount of historical data available will be displayed for each currency pai
Käufer dieses Produkts erwarben auch
This indicator is based on the Gann Signal indicator and acts as a market scanner. All you need to do is fill in the selected currency pairs in the settings and that’s it. Next, the indicator itself will view all these currency pairs and time frames from M5 to D1 simultaneously. When a new signal appears, the indicator will give you an Alert and also draw the letter N where this new signal will be.
Bomb Bank Signal
Igor Pereira Calil
5 (1)
Bombenbanksignal: Ihr Vertrauensindikator in MetaTrader 4 Bomb Bank Signal ist ein leistungsstarker Indikator für MetaTrader 4, der entwickelt wurde, um die relevantesten Trends auf dem Finanzmarkt zu identifizieren. Wenn Sie nach einem Tool suchen, das Bewegungen genau vorhersieht, ist die Bomb Bank der Verbündete, den Sie brauchen. So funktioniert es: Dieser Indikator kombiniert drei unterschiedliche Methoden – Volumenanalyse, Kerzenschließungen und symmetrischer Trend –, um Kauf- und V
BITTE LESEN SIE DIE INFORMATIONEN UNTEN, BEVOR SIE DAS PRODUKT KAUFEN! Apollo Pips PLUS SP ist ein einzigartiges Produkt! ES IST FÜR ALLE, DIE MEINEN NEUEN „APOLLO PIPS“-INDIKATOR PLUS „SUPER PACK“-BONUS MIT ZUGRIFF AUF ALLE MEINE HANDELSINDIKATOREN ERHALTEN MÖCHTEN! Mit dem Kauf des Produkts Apollo Pips PLUS SP erwerben Sie tatsächlich eine völlig neue Version meines Apollo Pips-Indikators. Diese Version des Indikators verfügt über einen verbesserten Algorithmus und einen benutzerfreundlichen P
Precautions for subscribing to indicator This indicator only supports the computer version of MT4 Does not support MT5, mobile phones, tablets The indicator only shows the day's entry arrow The previous history arrow will not be displayed (Live broadcast is for demonstration) The indicator is a trading aid Is not a EA automatic trading No copy trading function The indicator only indicates the entry position No exit (target profit)  The entry stop loss point is set at 30-50 PIPS Or the front
Septermber OFFER 85% OFF next price for unlimited version will be 2500$. This is the only time you can get this institutional and professional indicator at this price for unlimited version. Don't dare to miss this. The tool I am about to introduce to you you can't compare it with other tools due to its strategy and accuracy level in predicting the next price directional movement. This tool is designed for serious traders who have decided to make a difference through trading. Be the next person t
Dear Traders this is my another tool called " Swing Master Indicator ". As the name above the indicator is designed to help you in swing trading by capturing the low and highs of the price. You may us this tool with any trading strategy and style from scalping to position trading. It is made for level of traders including newbies and advanced traders even prop-firms, hedge funds and banks to help them make sold market analysis. I create tools for serious traders who want to make a difference in
Moving pivot Average Fibonacci The  indicator compares the selected period with its counterpart from the previous period. The indicator determines the moving Fibonacci levels for the day or any time interval to assess the price movement range from the time average. The indicator helps predict the expected high or low for the day based on historical time data. The pivot line can be considered an average trend line and use it in a variety of trading strategies. If you have any question about t
Der TRANSACTION SPEED ist der hochwertigste Indikator, der anzeigt, wo und wann sich große Aufträge auf dem Markt ansammeln und welche Vorteile dies mit sich bringt. Er erkennt Trendänderungen in einem sehr frühen Stadium. Er ist gleichzeitig ein Indikator und ein Handelssystem. Das Konzept ist einzigartig und unglaublich profitabel. Im Devisenhandel wird das Tick-Volumen irreführenderweise als Volumen bezeichnet. In Wirklichkeit handelt es sich um die Preisveränderung pro Zeiteinheit, was de
The indicator is designed to work on any trading platform. The program is based on proprietary algorithms and W.D.Ganna's mathematics, allowing you to calculate target levels of price movement based on three points with the highest degree of certainty. It is a great tool for stock trading. The indicator has three buttons: NEW - call up a triangle for calculation. DEL - delete the selected triangle. DELS - completely remove all constructions. The probability of achieving the goals is more than 80
Connect Indicator
Sukunthakan Ngernbamrung
Connect Indicator is a tool used for connecting indicators between the MQL market and MT4. The connected indicators are made by our group and can be used for other applications, such as sending messages to the Line application or Telegram application. If you have any questions, please don't hesitate to ask us to receive support. Function and indicator buffer Buffer one is the high price of the previous candle. Buffer two is the high price of the previous candle. Usage To connect indicators to fu
Al in one level
Kundan Kumar Srivastava
5 (1)
This indicator is collection of important dynamic support and resistance giving a trader crystal clear idea , where to sell and where to buy. it completely complements trend lines, support, resistance, and sideways market and allow a trader to make sustainable profits. The thickness of lines suggests its strengths, the thicker the dynamic line, the stronger is rejection or pullback allowing a trader to make multi-fold profit, as they can clearly see them. Introducing Your Ultimate Trading Edge
Full STO
Roman Smoroda
Vollständiger STO-Indikator (enthält alle Versionen der drei STO-Indikatoren: Premium, Gold, Silver) - STABLE TRADE OPTION ist für den automatischen Handel mit binären Optionen konzipiert.  VORSICHTIG LESEN!!!!! WICHTIG Erstellen Sie in einem Terminal zwei Vorlagen mit unterschiedlichen Verfallzeiten, eine Vorlage für 18:01, 18:02 mit Verfallzeiten von 1 bis 15 Minuten und eine Vorlage für 22:00 mit Verfallzeiten von 10 bis 20 Minuten. Gewinnrate: 71% in den letzten 5 Jahren Geldverwalt
Limitless MT4
Dmitriy Kashevich
Limitless MT4 ist ein universeller Indikator, der für jeden Anfänger und erfahrenen Trader geeignet ist. funktioniert auf allen Währungspaaren, Kryptowährungen, Rohstoffen Limitless MT4 - bereits konfiguriert und erfordert keine zusätzliche Konfiguration Und jetzt die Hauptsache Warum grenzenloses MT4? 1 völliger Mangel an Neuzeichnung 2 zwei Jahre Test durch die besten Handelsspezialisten 3 Die Genauigkeit der korrekten Signale übersteigt 80% 4 schnitten während der Pressemitte
NOTE: PRICE WILL RISE VERY SOON. DON'T SKIP THIS OFFER! Dear traders I am glad to introduce the " Market Swing Scanner Board" indicator to you. This indicator was made mainly to be used in combination with the Market Swing Index Indicator. You use the  "Market Swing Scanner Board"  indicator to scan for trading opportunities on the  Market Swing Index Indicator . This tool is designed for serious traders who have decided to make a difference through trading. Be the next person to witness this st
Robot Choppiness
Diego Mauricio Padilla Mendez
3 (2)
Der Choppines-Roboter wird als Indikator im MT4-Indikatorordner geladen Es wird empfohlen, eine Kerzenzeit von 5 Minuten zu verwenden, die empfohlene Ablaufzeit des Roboters beträgt 5 Minuten. Der Roboter kann so konfiguriert werden, dass er Signale an die Plattformen MT2, MX2 und PRICEPRO sendet. Um Signale zu senden, müssen Sie das Connector-Programm der Plattform verwenden, mit der wir arbeiten möchten. Führen Sie zur Installation auf dem Connector das folgende Verfahren durch (ein Bil
Currently Price 20% OFF ( for unlimited use )   BONUS  AUX VIP Club 2024 : Include  EA Airbag  and  Load Data History  to enhance the performance of this tool to its maximum potential  Click Here to Download Files   ( for users only )   Hello World! Introducing.. SMCpro VIP tool and Indicator for MetaTrader 4, designed to revolutionize your trading experience with the ICT Smart Money Concept. This system is meticulously crafted to empower traders with advanced insights and precision in
Oni Scalper
Goh Cheng Wai
5 (2)
Dear Onis, This Indicator is used for   GBPUSD, US30 and GOLD on 1-Min Chart . For US30 , Depending on your broker, Minimum Lot Size will differ from 0.01 to 1.0 lots. My Current Account is trading at 1.0 lots at $1 per point . Please check with your Broker what's the Margin Required for your Minimum lot sizes before you trade on your Real account. I have Forward Tested the indicator for around 6 months before releasing it to the public. ( No Demo is available for the Indicator, Strategy
Automatic, live & interactive picture of all trendlines. Assign push, email and sound alerts to the lines of your choice and be informed about price rollback, breakout, rollback after breakout, number of rollbacks, line expiration by double breakout. Correct, drag or delete the lines and interactively tune the line system. https://youtu.be/EJUo9pYiHFA . Chart examples https: //www.mql5.com/en/users/efficientforex Price Interaction Events All events are effective immediately and only after on
The indicator displays the probable ( Support and resistance ) levels. The indicator draws horizontal and trend levels of support and resistance. The indicator settings: Trends - the mode for displaying trend lines or horizontal lines of support and resistance Yes - display trend lines only No - display horizontal lines only UseResource - use the resources built into the indicator. Yes - use the ZigZag indicator from the resources of the product. No - use a custom ZigZag indicator. HistoryBar -
The indicator of a Professional Trader is an arrow indicator for predicting the direction of price movement. I have been working on this indicator since 2014. You can use this indicator as your main indicator, use its entry signals, and use it as your only indicator to find entry points. About the product: Recommended TF [H4-D1-W1]   . The indicator predicts the direction of the next candle. Fits a variety of tools; Flexibility in settings for different instruments and intervals through the
The [GRAFF] III manual trading system is based on multiple MetaTrader (MT4) indicators. Together, the entire PACK of GRAFF III indicators makes an advanced trading tool. The system consists of over 20 different custom-built indicators which have been carefully selected and tested in the long term to produce strong and efficient trading signals. The particular indicators are based on different mathematical formulas, so the entire system is calibrated to remove false signals from its own indicator
This indicator allows you to see the strength of the trend on all timeframes. It can be used for all currency pairs. The indicator can be displayed in the form of a column (from left to right): status buy / sell / strong buy / strong sell, strength of the trend in percentage, pips last candle, body candle now, remaining time, and the timeframe of M1 to MN. Information contained below (from left to right): total trend percent, sell percent, buy percent.
You can fins our other products from link : https://www.mql5.com/en/users/drbastem/seller   Also, you can ask all your questins from email : haskayafx@gmail.com or mobile : +90 530 867 5076 or @MehmetBastem    on telegram application This indicator is used to determine the trend. Standard Osma indicator is used. It has the indicator warning system: beep, e-mail and has three types of alerts, including messages to mobile phone. It shows the best performance on the chart of 5 minutes. When the
You can fins our other products from link : https://www.mql5.com/en/users/drbastem/seller   Also, you can ask all your questins from email : haskayafx@gmail.com or mobile : +90 530 867 5076 or @MehmetBastem    on telegram application This indicator is used to determine the trend. Standard Three Moving Average and ADX indicators are used. It has the indicator warning system (audio, e-mail) and three types of alerts, including messages to mobile phone. It shows the best performance on M5. When
This indicator is used to determine the trend. Standard Three Moving Average and ADX indicators are used. It has the indicator warning system (audio, e-mail) and three types of alerts, including messages to mobile phone. It shows the best performance on M5. When the trend value reaches the value set, the warning system is activated. This indicator works only with Forex symbols. Inputs SoundAlarm = true - Sound Alert Sendmail=true - Send an e-mail in case of a buy or sell signal Sendnotificatio
You can fins our other products from link : https://www.mql5.com/en/users/drbastem/seller   Also, you can ask all your questins from email : haskayafx@gmail.com or mobile : +90 530 867 5076 or @MehmetBastem    on telegram application This indicator is used to determine the trend. Standard MACD indicator is used. It has the indicator warning system: beep, e-mail and has three types of alerts, including messages to mobile phone. It shows the best performance on the chart of 5 minutes. When the
Regression Channel Tools" basiert. Durch die Nutzung dieses Tools können Trader eine außergewöhnliche Kontrolle über ihren Chart-Regression-Kanal erlangen und fundiertere Handelsentscheidungen treffen. Das Regression Channel Tool ist ein leistungsstarkes Instrument im Werkzeugkasten eines Traders. Es soll wertvolle Einblicke in Preisentwicklungen und potenzielle Unterstützungs- und Widerstandsniveaus bieten. Das Tool eignet sich besonders gut zur Visualisierung von Korrekturwellen innerhalb eine
A simplistic indicator informing a user on RSI divergence by sending messages to mobile device and email. The indicator draws 2 vertical lines, marking two RSI extrema that formed the divergence. You get the alert, open the charts and make a decision. The indicator does not show past divergences, thus when you attach it to a chart for the first time you see nothing. Graphics and alerts will appear as soon as divergences do. Drop it in Tester to see how it works. Parameters: RSIPeriod - number of
ZLevels
Sergio Andres Zuleta Lopez
This indicator is based on Market Profile methodology, which contains the Z-Zone , unlike the latter, allows visualization of multiple time frames on the same graph. This methodology has proven to be very effective for: Reduce the number of windows required to analyze or track a financial asset. Display important resistance areas (ROZ), support (SoZ) and average distribution (PoC) in different periods of time. Define areas to take profits as well locate technical stop loss. Analysis in the devel
Weitere Produkte dieses Autors
Die präzisen Ziele von GANN werden basierend auf seinen bewährten Methoden berechnet und direkt vor Ihnen angezeigt. Dieses Tool wurde entwickelt, um das Trading einfacher und intuitiver zu gestalten. Wenn Sie die weiße Linie nach oben oder die grüne Linie nach unten ziehen, werden Sie sofort verstehen, warum GANNs Techniken in der Welt des Tradings nach wie vor einflussreich sind. GANNs Strategien konzentrieren sich darauf, Marktbewegungen mit hoher Genauigkeit vorherzusagen, und dieses Tool br
Imbalance Pro
Ivan Stefanov
5 (1)
Der Indikator misst das Ungleichgewicht zwischen Bullen und Bären über einen bestimmten Zeitraum und zeigt eine gerade Linie zwischen den beiden Punkten. Wenn die Bullen mehr Volumen haben als die Bären, wird die Linie grün.  Wenn die Bären mehr Volumen haben, ist sie rot. Die Linie zeigt auch den prozentualen Unterschied im Volumen an. Der Indikator zeigt die gleichen Daten in einem separaten Fenster an. Sie können auch das geteilte Volumen sehen. Der Indikator hat zwei Modi. Zu dies
Sense
Ivan Stefanov
SENSE ist ein automatisiertes System, das ausgewählte GANN-Methoden mit fraktalen Berechnungen kombiniert. Das System sagt uns, wo wir Trades eröffnen und schließen sollen. Sie brauchen keine Zeit mehr mit komplexen Berechnungen zu verschwenden - SENSE macht alles für Sie. Installieren Sie einfach den Indikator. Grundprinzipien: Der Markt ist bullisch, wenn der Preis über den weißen Linien liegt. Kaufen Sie oberhalb der weißen Linien, stoppen Sie unterhalb Grüne Linien sind Aufwärtsziel
Levelss
Ivan Stefanov
5 (1)
Der Indikator LEVELSS zeigt an: - Tägliche bullische und bearische Zone. Er ist täglich von 00:00 bis 23:59 Uhr sichtbar.  - Die wöchentliche Hausse- und Baissezone. Sie ist jede Woche von Montag 0:00 Uhr bis Freitag 23:59 Uhr sichtbar. - Speziell berechneter Kanal aus einem bestimmten Zeitrahmen, der auf allen anderen Zeitrahmen angezeigt wird. Standardmäßig ist dies der 4-Stunden-Zeitrahmen, den Sie auf jeden anderen Zeitrahmen, den Sie handeln möchten, ändern können. Er wird nonstop berech
Two Snakes
Ivan Stefanov
5 (1)
2 SNAKES ist ein erstklassiges Scalping-System. Da die Eingaben sehr präzise sind, werden Sie wahrscheinlich sehr schnell süchtig nach diesem System werden.  Sie haben 2 Schlangen. Wenn Sie eine Kerze über oder unter ihnen sehen, die sie nicht berührt - das ist Ihr Scalping-Signal. Wenn Sie einen größeren Zeitrahmen verwenden, kann Scalping zu Trendfolge werden. Die Schlangen werden genau in Bezug auf die aktuelle Marktlage berechnet. Sie sind keine gleitenden Durchschnitte.  Sie en
Der TRANSACTION SPEED ist der hochwertigste Indikator, der anzeigt, wo und wann sich große Aufträge auf dem Markt ansammeln und welche Vorteile dies mit sich bringt. Er erkennt Trendänderungen in einem sehr frühen Stadium. Er ist gleichzeitig ein Indikator und ein Handelssystem. Das Konzept ist einzigartig und unglaublich profitabel. Im Devisenhandel wird das Tick-Volumen irreführenderweise als Volumen bezeichnet. In Wirklichkeit handelt es sich um die Preisveränderung pro Zeiteinheit, was de
Dieser Indikator trennt das Tick-Volumen auf dem Devisenmarkt effektiv in bullische und bearische Kategorien. Darüber hinaus bietet er die Möglichkeit, die Summe der bullischen und bearischen Tick-Volumina für einen von Ihnen gewählten Zeitraum zu berechnen und anzuzeigen. Sie können den Zeitraum ganz einfach anpassen, indem Sie die beiden blauen Linien im Diagramm verschieben. So können Sie die Analyse des Handelsvolumens genau auf Ihre Bedürfnisse abstimmen. Wenn Sie es nützlich finden,
FREE
Dieser Indikator beruht auf praktischen Erfahrungen.  Geben Sie das Datum/die Uhrzeit Ihres Top/Bottom ein. Er berechnet das meistbesuchte Niveau von Top/Bottom bis zum aktuellen Moment. Er aktualisiert sich automatisch mit jeder neuen Kerze. Sie können gleichzeitig mehrere Indikatoren für verschiedene Trends und Zeitrahmen verwenden. Die Länge wird immer vom Beginn der Periode bis zum aktuellen Zeitpunkt angezeigt. Nützliches PRO-Tool.
FREE
Versuss
Ivan Stefanov
Versuss ist ein spezielles Tool. Der Indikator kann neue Werkzeuge für Ihre Analyse erstellen. Sie können beliebige zwei Instrumente auf Ihrer Plattform vergleichen. Beispiel 1   Wenn Sie USDJPY handeln, kann Ihre Analyse auch SP500 und NIKKEI225 umfassen.   Mit Versuss können Sie vergleichen, wie sich ein Index im Verhältnis zum anderen bewegt und dies dann mit dem Währungspaar USDJPY vergleichen. Wenn der Devisenmarkt den Bewegungen der Indizes folgt, können Sie eine klare Prognose darübe
FREE
In der Handelswelt gilt ein Trend, der einem 45-Grad-Winkel folgt, als nachhaltig.  Die genaue Messung dieses kritischen Winkels bleibt jedoch eine Herausforderung, da keine eindeutige Methode beschrieben ist. Händler können nur raten, wie er berechnet wird, wie viele Kerzen gezählt werden sollten und was der geeignete Chart-Zoom ist. Wir haben dieses Problem gelöst und alle Bedingungen logisch definiert und präsentieren Ihnen nun Trend Angle 45. Es handelt sich um ein Tool, das die 45-Grad-T
Auswahl:
vincenzo1964
913
vincenzo1964 2024.07.11 15:59 
 

Assolutamente straordinario a cominciare da chi l'ha ideato Ivan, Sono assolutamete felice dell'affito/prova fatto, Enigmera è sorprendente, ti accompagna sempre sul lato giusto della tendenza sino alla fine del percorso. Se poi parliamo del dott. Ivan e della sua disponbilità, se potessi postare gli screenshot e la guida passo passo che mi ha concesso, è commovente e sorprendente. Se volete fare buon trading con giudizio e responsabilità potete tranquillamente perdere qualche giorno del vostro tempo a capire la logica ed il ragionamento che c'è dietro enigmera, solo così sarete sempre dal lato giusto del trend sino alla fine, sopratutto quando ci sono le news ed enigmera già vi sta indicando i livelli di tp da raggiungere. Proprio oggi ero già lon su eurusd e sell su usdchf ed entrambe dopo le notizie chiuse in tp. Consiglio anche l'indicatore Speed, leggetene l'utilizzo, la forza e ciò che vi può indicare, io ci sto lavorando sodo seguito da ivan perchè l'unione di enigmera e speed è devastante, alla fine dell'affitto acquisterò engmera mentre affitterò mensilmente speed (il costo è di 30.00€ mentre l'acquisto è di 3000€), ma il suo potenziale per il trend followhing e immenso, saluti e buon trading a tutti, grazie Ivan...

Irfan
1150
Irfan 2024.06.21 13:44 
 

Der Benutzer hat keinen Kommentar hinterlassen

Sajid Iqubal
97
Sajid Iqubal 2024.06.08 21:59 
 

Enigmera is an exceptional trading indicator that has greatly improved my trading performance. Ivan Stefano offers the best support and guidance, always going above and beyond like an elder brother to me. His guidance and the effectiveness of Enigmera make a winning combination. I highly recommend using Enigmera.

eman11
1028
eman11 2023.11.22 20:29 
 

Der Benutzer hat keinen Kommentar hinterlassen

ebel
1191
ebel 2023.11.22 14:41 
 

This indicator is undoubtedly expensive but I believe it to be the Ferrari of indicators and the only one you will ever need. The video in the overview is self explanatory, take the time to find the setups as described and the R:R can be extremely good. I have only been using the indicator for a week but have found several very profitable trades and feel confident that I can make back more than sufficient each month to cover my 6 monthly rental. The author is extremely responsive and helpful and is starting a telegram group so that we can share prospective setups. I believe the indicator is difficult to get to work in Strategy Tester but the author is open to free trials which demonstrates his trust in the product. I can't post images here but I will post a trade I made this morning in the comments. I can't promise it is the perfect setup as I am still learning but just this one trade covered my monthly rental cost. IMPORTANT - do not try to change to a lower timeframe while the indicator is loaded. The code is incredibly complex and trying to recalculate everything on a lower tf over a significant period will freeze your MT4 installation. You will need to delete the indicator from your MT4, force a shut down, restart and re-install. Once you understand the complexity it is not a problem, just open another chart on a lower tf or delete the indicator, change the tf and put it back on.

UPDATE 23/11

I have just seen that the author has been debarred from selling! I have just paid for 6 months rental and this is a good indicator that is making me money. What to I do after 6 months if I can't renew? And why has this happened, the author is very courteous and helpful.

Antwort auf eine Rezension
Version 2.24 2024.08.06
More friendly labels.
Version 2.23 2024.06.18
The update is quite important. The convenience is undeniable:

- Just add the indicator to the chart. It is no longer necessary to enter the date and time.
- Putting a top or bottom is done by pulling and dragging the indicator.
- Reestimation of the trend is much more faster.

Enjoy!
Version 2.1 2024.06.09
- Warning when target is reached
- Line labels added. On/Off option
- Warning if indicator is not placed correctly
- Indicator identifier (when using more than one indicator on a graphic)
Version 2.0 2024.06.02
1. Elliott-Kanal hinzugefügt. Sie können jetzt jeden beliebigen Zeitrahmen für den Elliott-Kanal verwenden. Standardmäßig sind es 4 Stunden. Dies kann Ihre Zählung vereinfachen.
2. Auto Fibonacci Zeitzonen hinzugefügt. Auch dies kann Ihre Zählung erleichtern.
3. Auto 50% Linie hinzugefügt. Bedeutend für jede Ebene der Bewegung.
4. Es gibt eine Option zur Begrenzung der Anzahl der Kerzen, die der Indikator berechnet. Der Standardwert ist 377. Diese Anzahl ist ausreichend, um die meisten Bewegungen zu messen. Sie können sie nach Ihren Vorstellungen ändern.
5. Die Nicht-Reaktion aufgrund von Massenfraktalberechnungen beim Wechsel vom hohen zum niedrigen Zeitrahmen wurde beseitigt. Dies ist kein Problem mehr.
6. Schnellere Leistung durch Optimierung des Codes.
7. Zusätzliche Optionen für Farben und Linien.
8. Bezeichner hinzugefügt. Wenn Sie den Indikator mehrmals in einem Diagramm verwenden wollen, ist es eine gute Idee, für jede Instanz einen neuen Bezeichner zu verwenden. Auf diese Weise wird der Indikator für jede Instanz andere Puffer verwenden.
9. Einige Änderungen an der Benutzeroberfläche. Die Ziellinien wurden fett gedruckt, um sie wichtiger zu machen und die Aufmerksamkeit zu erhöhen.
Version 1.3 2024.01.05
In der neuen Version sind folgende
Trendbewertungsinstrumente hinzugefügt:

- 45-Grad-Winkel-Linie
- 45-Grad-Abweichungslinien