Oracle Scalper
- Indikatoren
- Andrey Kozak
- Version: 2.0
- Aktualisiert: 27 Juni 2023
- Aktivierungen: 20
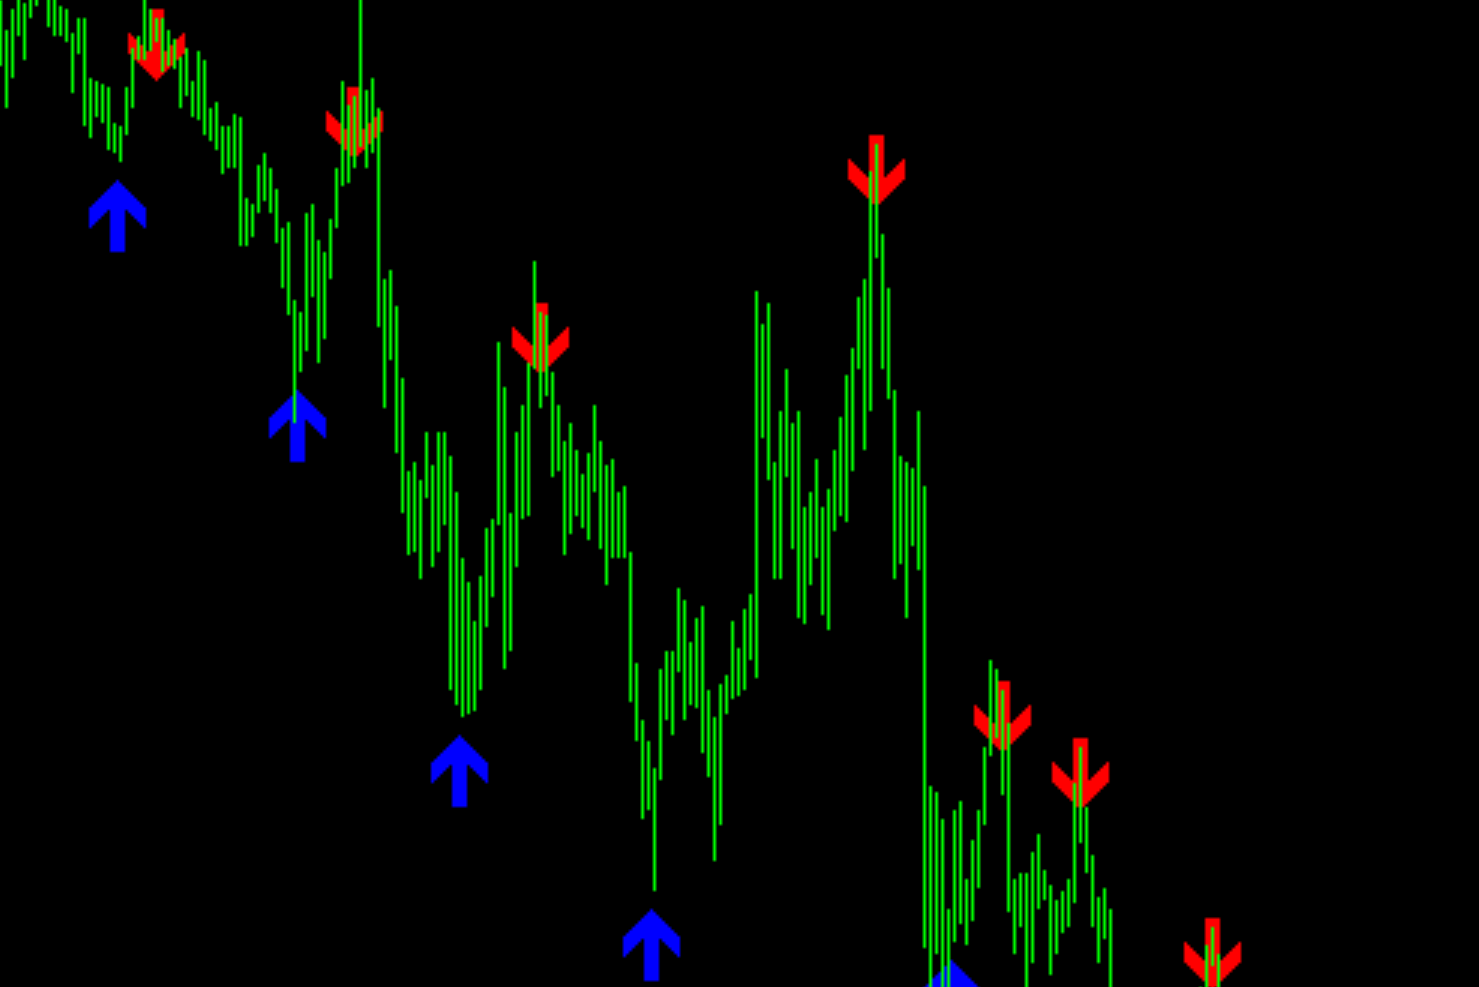
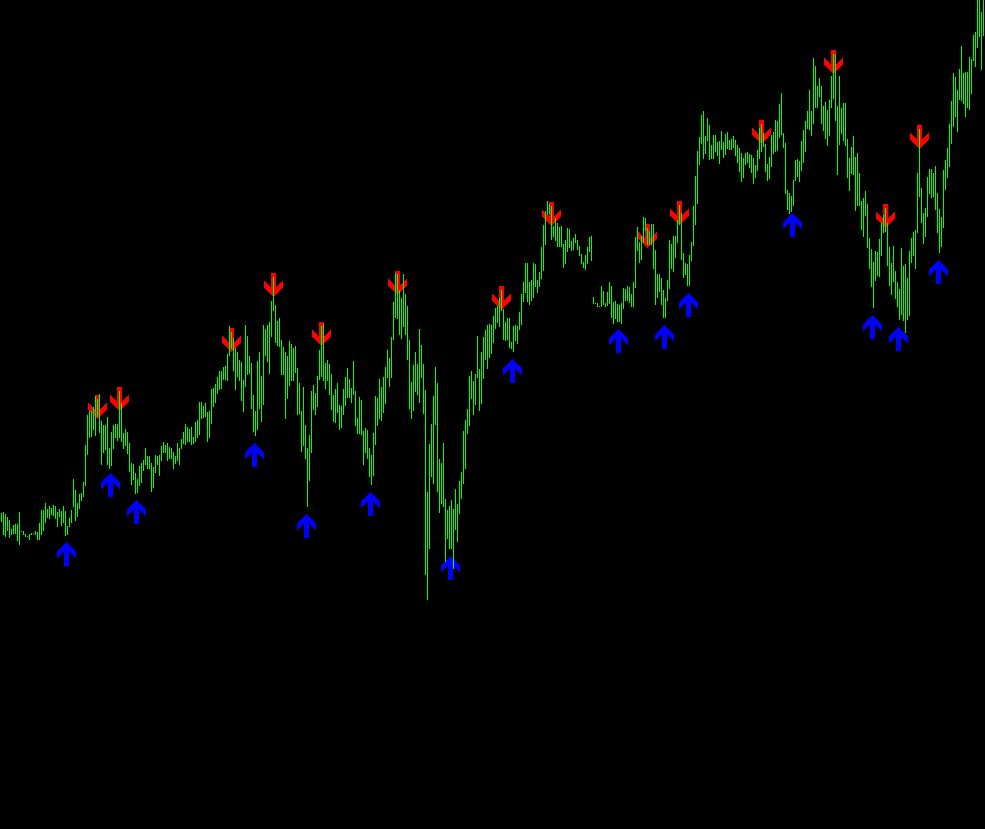
Ein Pfeilindikator ist ein Indikator, der Pfeile auf einem Diagramm anzeigt, um die Richtung des Marktes anzuzeigen. Der rote Pfeil zeigt eine implizite Abwärtsbewegung an, während der blaue Pfeil eine implizite Aufwärtsbewegung anzeigt. Der Indikator funktioniert für alle Zeitrahmen und alle Währungspaare.
Handelsstrategie basierend auf dem Pfeilindikator:
Positionseintrag:
- Wenn der rote Pfeil erscheint, eröffnen Sie eine Verkaufsposition (Short).
- Wenn der blaue Pfeil erscheint, eröffnen Sie eine Kaufposition (Long).
- Der Einstieg erfolgt beim Öffnen des nächsten Balkens nach Erscheinen des Pfeils.
- Die Losgröße wird unter Berücksichtigung der Parameter Risiko und verfügbares Kapital berechnet.
Positionsmanagement:
- Stellen Sie das Stop-Loss-Level je nach Währungspaar auf einen Abstand von 50-150 vom Einstiegspunkt ein.
- Darüber hinaus können Sie einen Trailing Stop anwenden, um Gewinne zu schützen und sich vor möglichen Rückwärtsbewegungen zu schützen.
Eine Position schließen:
- Schließen Sie die Position bei Erreichen des Take-Profit-Levels, das auf einen Abstand von 25-45 Punkten (je nach Währungspaar) vom Einstiegspunkt eingestellt werden kann.
- Wenn ein entgegengesetzter Pfeil erscheint, schließen Sie die aktuelle Position und öffnen Sie eine neue Position entsprechend der neuen Richtung.
Anzeigeeinstellungen:
- period – Geben Sie den Mittelungszeitraum an.
- UpperBorder – die obere Grenze des Kanals zur Eröffnung von Verkaufsgeschäften.
- LowerBorder – die untere Grenze des Kanals zur Eröffnung von Kaufgeschäften.
- Moment – Mittelungszeitraum zur Berechnung des iMomentum-Indikators.
- sar – Zeitraum des iSAR-Indikators.
- width – Geben Sie die Größe der Signalpfeile an, die auf dem Bildschirm angezeigt werden.