Kostenpflichtige Handelsroboter und Indikatoren für den MetaTrader 5 - 88

1. Why did I develop this series of indicators
I found that most traders need to use multiple time frame indicators. They usually switch time frame to see indicators. However, once the timeframe is switched, you cannot see the corresponding relationship between the price in the smaller timeframe and the indicator in the larger timeframe . For example: if your price chart is in H1 timeframe, you can see H4, D1 and W1 indicators in H1 timeframe Chart. This is more helpful for you to find t

Just $10 for six months!!!. This will draw Supply & Demand zones just by clicking on a candle. It can also draw a 50% line on the zone. https://youtu.be/XeO_x7cpx8g As a drawing tool, it is not active all the time after adding it to the chart.
Activate by pressing 's' twice on the keyboard within a second. If activated but then decided not to draw, deactivate by pressing 's' once. Box color depends if candle is above or below current price.
Features: Draw the box up to the last current can

Panthers Traders presents the new Expert Advisor "MRK TRADER", a robot for Forex, Indices, Commodities and Cryptocurrencies. This expert advisor works hedge strategies, has different variables to configure each other, works as a work tool or as a 100% automatic expert advisor, if you do not have experience, for your greater profitability, get in touch by private and I will explain your different variables and how to apply them in different assets, I recommend watching the videos of the YouTub

Backtest from 2003-2019 MetaQuotes Data Every Tick Mode
EA created for EURUSD H1
Open transaction based on MA and Volume
Close transaction based on RSI or take profit
One transaction at the time.
No adding position, no martingale, no grid.
My recommendations: For "safe mode" i recommend 0.1 lot per 10000USD
For "risky mode" i recommend 0.5 lot per 10000USD
Personally i use 0.3 lot per 10000 USD
Fell free to increase lot size while you earn.
This EA does not open transaction e

The Rise of Skywalker: It is an advanced trading system. This is a fully automatic Expert Advisor, which allows you to presize the trade according to the preferences of the trader. Is a revolution in the customization of the trading. The Rise of Skywalker is a expert advisor based in the indicator The Rise of Sky walker: ( https://www.mql5.com/es/market/product/44534 ) This system uses only one trade in each operation. Do not use Grip or martingale Low risk system since it h

Der Indikator für den Handel mit den Signalen des harmonischen Musters AB = CD. Es gibt Signale und zeigt die Markteintrittsniveaus sowie die Niveaus für die Platzierung von Stop-Orders an, wodurch der Händler rechtzeitig Entscheidungen über den Markteintritt treffen und Positionen und Orders effektiv verwalten kann. Unterstützt das Senden von Push-Benachrichtigungen an ein mobiles Gerät, E-Mail sowie Warnungen. Dieser Indikator wurde aus der Version für MetaTrader 4 portiert. Weitere Informatio
Rectangle Detector Alert
About Rectangle Detector Alert Indicator
Rectangle detector alert detects manually drawn rectangle shapes on charts and sends out push notifications
also auto extending the rectangles at the same time as new candles form.
The concept behind this indicator is based on the manual trading of supply and demand zones. Most traders prefer
to draw their supply (resistance) and demand (support) zones manually instead of depending on indicators to auto draw
the

This product is a set of tools that help the trader to make decisions, bringing information from different categories that complement each other: trend, support / resistance and candle patterns. It also has a panel with information about the balance. The trend has two different calculations and is shown as colored candles. Strategy 1 is longer, having 3 different states: up, down and neutral trend. Strategy 2 has a faster response and has only 2 states: up and down trend. Support and resistance

The main idea of this product is to generate statistics based on signals from 5 different strategies for the Binary Options traders, showing how the results would be and the final balance based on broker's payout.
Strategy 1: The calculation is secret. Strategy 2: The signal is based on a sequence of same side candles (same color). Strategy 3: The signal is based on a sequence of interspersed candles (opposite colors). Strategy 4: The signal consists of the indicators bollinger (we have 3 typ

Versão Darkray para Bolsa de Valores (Ações, Fundos Imobilirários, contratos futuros, etc.) O Robô DarkrayB3EA usa uma estratégia baseada no retorno a média, conjugada a detecção de zonas de exaustão de compra e de venda. Indicadores disponíveis para configurações de setups: EMA200 à Média móvel de 200 períodos (podem ser usados outros períodos com ótimos resultados também); RSI à Verifica os níveis de sobre venda para abertura das vendas e sobre compra para abertura das compras; ADX à Veri
This indicator measures the largest distance between a price (high or low) and a moving average. It also shows the average distance above and below the moving average. It may come in handy for strategies that open reverse positions as price moves away from a moving average within a certain range, awaiting it to return so the position can be closed. It just works on any symbol and timeframe. Parameters: Moving average period : Period for moving average calculation. Moving average method : You can

The Candlestick Patterns indicator for MT5 includes 12 types of candlestick signales in only one indicator. - DoubleTopsAndBottoms - SmallerGettingBars - BiggerGettingBars - ThreeBarsPlay - TwoBarsStrike - Hammers - InsideBars - OutsideBars - LongCandles
- TwoGreenTwoRed Candles - ThreeGreenThreeRed Candles The indicator creats a arrow above or under the signal candle and a little character inside the candle to display the type of the signal. For long candles the indicator can display the exac

Walking Pips ist ein Expert Advisor für Scalping, der entwickelt wurde, um in einem volatilen Markt zu arbeiten. Geeignet für die Zusammenarbeit mit allen Brokern, einschließlich amerikanischer Broker mit einer FIFO-Anforderung - vor allem der Abschluss zuvor eröffneter Geschäfte. Alle Orders werden von einem virtuellen Stop-Loss und Take-Profit in Pips sowie einer Breakeven- und Trailing-Stop-Funktion begleitet. Der Chart zeigt Informationen über die Geschwindigkeit der Orderausführung und Sli
FuturesBot NQ100 Advisor works only on NETTING accoun ts!
Trading Advisor " FuturesBot NQ100 "is intended solely and exclusively for trading futures on the CME Group exchange
Advisor is adapted for trading futures contracts: - E-mini Nasdaq-100 Futures
- micro E-mini Nasdaq-100 Future
The specification of the E-mini Nasdaq-100 Future contract is available at the following link on the exchange website:
https://www.cmegroup.com/trading/equity-index/us-index/e-mini-nasdaq-100_contract_sp
This utility tool draws the ticker symbol and timeframe information as a watermark in the background of the chart. It may come in handy if you have multiple charts on the screen at the same time. Inputs: Font Name: You can change text font by typing in the name of your favorite font installed on your operating system. (e.g.: Verdana, Palatino Linotype, Roboto, etc...) Font Color: You can choose your favorite from the available colors or type in a custom RGB color (values from 0 to 255, e.g.:

mql4 version: https://www.mql5.com/en/market/product/44606 Simple indicator to calculate profit on fibonacci retracement levels with fixed lot size, or calculate lot size on fibonacci levels with fixed profit. Add to chart and move trend line to set the fibonacci retracement levels. Works similar as default fibonacci retracement line study in Metatrader. Inputs Fixed - select what value will be fix, lot or profit Fixed value - value that will be fix on all levels Levels - levels for which

Horizontal Volumes Indicator - using a histogram, displays the volume of transactions at a certain price without reference to time. At the same time, the histogram appears directly in the terminal window, and each column of the volume is easily correlated with the quote value of the currency pair. The indicator practically does not require changing the settings, and if desired, any trader can figure them out.
The volume of transactions is of great importance in exchange trading, usually an in

Trend indicator Carina . The implementation of the trend indicator is simple - in the form of lines of two colors. The indicator algorithm is based on standard indicators as well as our own mathematical calculations. The indicator will help users determine the direction of the trend. It will also become an indispensable adviser for entering the market or for closing a position. This indicator is recommended for everyone, both for beginners and for professionals.
How to interpret information f
This app supports customer investments with equipment financing and leasing solutions as well with structured chat Our success is built on a unique combination of risk competence, technological expertise and reliable financial resources.
Following topics are covered in the Trading Support Chat -CUSTOMISATION -WORKFLOW -CHARTING TIPS -TRADE ANALYSIS
PLEASE NOTE That when the market is closed, several Brokers/Metatrader servers do not update ticks from other timeframes apart from the current

Night Scalper ist ein Scalping-System für die Arbeit in einem ruhigen Markt bei Nacht. Verwendet kein Martingal oder Gitter. Geeignet für alle Broker, einschließlich US-Broker mit FIFO-Regeln. Alle Orders werden von einem virtuellen Stop-Loss und Take-Profit in Pips begleitet, die Werte können entweder fest oder dynamisch sein. Es hat auch einen virtuellen Trailing Stop und Break-Even. Der Chart zeigt Informationen über die Geschwindigkeit der Orderausführung und Slippage an.
Link zur MT4

KT Power Pennant finds and marks the famous pennant pattern on the chart. A pennant is a trend continuation pattern with a significant price movement in one direction, followed by a period of consolidation with converging trend-lines.
Once a pennant pattern is formed, a buy/sell signal is provided using a bullish or bearish breakout after the pattern formation. MT4 Version is available here https://www.mql5.com/en/market/product/44713
Features
Pennant patterns provide a low-risk entry aft

The Rise of Sky walker is a trend indicator is a powerful indicator for any par and any timeframe. It doesn't requires any additional indicators for the trading setup.The indicator gives clear signals about opening and closing trades.This Indicator is a unique, high quality and affordable trading tool. Can be used in combination with other indicators Perfect For New Traders And Expert Traders Low risk entries. Never repaints signal. Never backpaints signal. Never recalculates signal. Great Fo

RageX EA is an unique fully automated EA which analyses current market trend on time-frame basis. Thanks to that it makes performance of this EA stable regardless the current market condition like slippage, execution speed, etc. Every order is protected by automatically calculated stop-loss. RageX EA successfully passed 100% quality data back-tests in Metatrader 5 with different execution speed as well as back-tests with 99.90% quality historical data and variable spread in Metatrader 4. Link

Introduced expert system works with the EURUSD currency pair and only with it. This system implemented the principle of five orders - that is, a maximum of five orders can be placed in one direction, after which the total position of the series should be closed by stops, either real or virtual. The trading system is designed to work separately with a series of buy orders and separately with a series of sell orders. which makes the trading system versatile enough. The expert passes all types o

KT Stochastic Divergence robot is a 100% automated expert advisor that trades regular and hidden divergence built between the price and Stochastic oscillator. The divergence signals are fetched from our freely available Stochastic Divergence indicator.
Not every divergence ends up in a successful price reversal, that's why this ea combines the raw divergences signals with its inbuilt technical analysis module to exploit the price inefficiency that occurs after some selected divergence signals

KT RSI Divergence robot is a 100% automated expert advisor that trades regular and hidden divergence built between the price and Relative Strength Index (RSI) oscillator. The divergence signals are fetched from our freely available RSI divergence indicator.
Not every divergence ends up in a successful price reversal, that's why this ea combines the raw divergences signals with its inbuilt technical analysis module to exploit the price inefficiency that occurs after some selected divergence si

Powerful trend indicator provided with all necessary for trade and it is very easy to use. Everyone has probably come across indicators or Expert Advisors that contain numerous input parameters that are difficult to understand. But here, input parameters are simple and it is no need to configure anything — neural network will do all for you.
Difference from a classic version
The real-time multi time frame panel is added, so you can check a trend for other timeframes without switching the sche

- This is an indicator of directional movement that allows you to determine the trend at the time of its inception and set the levels of a protective stop.
Trailing can be carried out both from below, when the stop level is below the current price and is pulled up behind the price if it increases, and above, when stop levels are above the current price.
Unlike trailing with a constant distance, the stop level is set at the lower boundary of the quadratic regression channel (in the case of t

The adviser uses a strategy based on the use of custom indicators; trading is carried out on 4 time frames. The expert uses the adaptive system for determining market entries for trading, which determines the most appropriate moment for opening an order. The adviser trades according to numerous patterns on currency pairs. The adviser uses economic news to achieve more accurate signals. Hidden Stop loss, Take Profit, Break Even and Trailing Stop are used. Use multicurrency testing for 11 currency
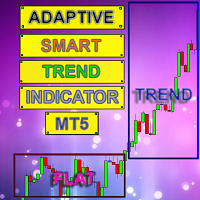
Smart indicator Adaptive Smart Trend Indicator determines the sectors of the Trend and the Flat and also in the form of a histogram shows the breakdown points of the levels (1 - 5).
The indicator performs many mathematical calculations to display more optimal Trend movements on the chart.
The program contains two indicators in one: 1 - draws the Trend and Flat sectors, 2 - the histogram indicator shows the best signals for opening an order. The indicator autonomously calculates the mo
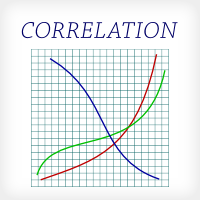
This indicator is fully user-adjustable, calculates corellation between all symbols, which you want. Indicator is real-time updated and fully automated. You can adjust a lot of parameters.
Calculation Parameters List of symbols: write all symbol, which you want to calculate, just separate them by comma Calculated bars: amount of bars from which will be calculated Time frame: time period of calculation Used price: used price - 0 (CLOSE), 1 (OPEN), 2 (HIGH), 3 (LOW), 4 (MEDIAN), 5 (TYPICAL), 6

Crossing of market price and moving average with all kinds of alerts and features to improve visualization on the chart.
Features Crossing of market price and Moving Average (MA) at current bar or at closing of last bar; It can avoid same signals in a row, so it can allow only a buy signal followed by a sell signal and vice versa; MA can be set for any of the following averaging methods: Simple Moving Average (SMA), Exponential Moving Average (EMA), Smoothed Moving Average (SMMA), Linear-w
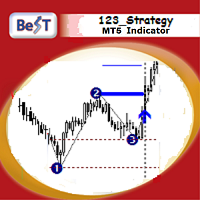
BeST_123 Strategy is clearly based on the 123 Pattern which is a frequent Reversal Chart Pattern of a very high Success Ratio .It occurs at the end of trends and swings and it’s a serious indication of high probability for a change in trend.Theoretically an 123_pattern is valid when the price closes beyond the level of #2 local top/bottom, a moment when the indicator draws an Entry Arrow, raises an Alert, and a corresponding Position can be opened.
The BeST 123_Strategy Indicator is non-repai
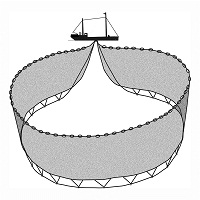
Dragnet mt5 Vollautomatischer Handelsroboter. Verwendet keine Indikatoren, vermarktet ständig. Analysiert die aktuellen offenen Positionen, um Handelsentscheidungen zu treffen. Es gibt kein Martingal, keine Erhöhung der Handelslose. Beschreibung der Einstellungen Count_All - Anzahl der Positionen für den Gesamtgewinn Lot - Positionsvolumen, wenn = 0, funktioniert der Risikoparameter Risiko - automatische Lotberechnung aus dem Handelskontostand TakeProfit - Gewinnniveau einer einzelnen Position

Every trader knows that he or she should never Risk more than 2% (or 5%) per trade. This is a Money Management law and an usable LotSize should be calculated each time because a trader must use a different StopLoss value for different Support and Resistant level. This indicator will calculate an appropriate LotSize for the moment when you will put it on the chart and each time you will drag the "Stop Loss Line" in any direction.
Inputs: Order_Type - Buy or Sell TakeProfitPoints - how many p

The VMA is an exponential moving average that adjusts its smoothing constant on the basis of market volatility. Its sensitivity grows as long as the volatility of the data increases. Based on the Chande's Momentum Oscillator, the VMA can automatically adjust its smoothing period as market conditions change, helping you to detect trend reversals and retracements much quicker and more reliable when compared to traditional moving averages.

RSI Swinger
Es ist unpraktisch, Ihre Zeit mit dem Handeln auf der Grundlage technischer Indikatoren zu verbringen, wenn Software die gleiche Aufgabe auf eine risikobehaftete Weise ausführen könnte.
Dieser Expert Advisor stützt sich auf den RSI-Indikator, um Preisschwankungen zu handeln.
Was bietet dieser EA?
- Konfigurierbare RSI-Decken- und Bodenwerte
- Anpassbare Handelsstrategie (siehe Swing-Parameter)
- Fortgeschrittener Nachlaufstopp
EA-Parameter:
- Lautstärke (Sta

The utility places virtual (hidden from your broker) trailing stop, breakeven, stop loss and take profit. It is necessary to allow automated trading in the terminal settings. In testing mode, the utility opens Buy or Sell positions on the first ticks, which allows you to visually observe the given logic, changing the utility parameters. In real mode, the utility does not open positions. Parameters magic - magic number. If less than 0, positions with any magic number are tracked. only_this_sym

The utility places trailing stop, breakeven, stop loss and take profit. It is necessary to allow automated trading in the terminal settings. In testing mode, the utility opens Buy or Sell positions on the first ticks, which allows you to visually observe the given logic, changing the utility parameters. In real mode, the utility does not open positions. Parameters magic - magic number. If less than 0, positions with any magic number are tracked. only_this_symbol - only chart symbol. If fals
(Übersetzt mit Google)
Sie müssen Ihre Positionsgröße nicht mehr berechnen.
Stellen Sie die Risikogröße in% ein (basierend auf Ihrem Kontostand) und suchen Sie dann Ihr StopLoss-Level Ihrer potenziellen Position. Ihr Trade wird mit der richtigen Positionsgröße ausgeführt.
Sie haben die Möglichkeit, alle schwebenden Positionen auf dem Instrument zu schließen, auf dem Sie sich gerade befinden, indem Sie auf die Schaltfläche "SCHLIESSEN" klicken.
Wie benutzt man?
Befestigen Sie den E

IlanisNeuro MT5 - expert variation Ilanis . The expert Advisor uses averaging. A neural network is used to open positions. The network was trained on seven major currency pairs (EURUSD, GBPUSD, AUDUSD, NZDUSD, USDJPY, USDCHF, USDCAD) in the interval 2010-2019. Compared to the MT4 version , the expert Advisor was able to multi-currency trading from a single chart and was retrained on fresh data. Version monitoring for МТ4: https://www.mql5.com/en/signals/339250 Free version: https://www.mql5.c

Smart YTG mt5 Expert Advisor für das MT4-Terminal Smart YTG wurde geschrieben, um an den Währungspaaren GBPUSD und EURUSD zu arbeiten, Chartperiode H1. Im Wesentlichen ist das System Trending und funktioniert perfekt auf Trendabschnitte der Preisbewegung mit STOP-Orders, der Trend wird durch die Analyse des im Inneren des Expert Advisors integrierten Price Channel-Indikators bestimmt; es ist keine zusätzliche Installation des Indikators erforderlich. In den flachen Bereichen, wenn der Markt
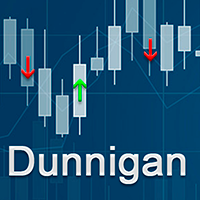
This is a trend indicator based on a strategy created by William Dunnigan that emit signals to buy or sell on any timeframe and can assist in decision making for trading on stock market or Forex. The signals are fired according to the following rules: Buy Signal = Fired at the first candlestick in which close price is higher than the higher price of the last candlestick. The higher and lower prices of the current candlestick must be higher than the corresponding ones of the last candlestick as w
Wir stellen den Awesome Oscillator Alert vor, einen leistungsstarken technischen Indikator, der Händlern wertvolle Einblicke in die Marktdynamik und Handelsmöglichkeiten bietet. Mit seinen umfassenden Funktionen und der benutzerfreundlichen Oberfläche ist dieser Indikator ein unverzichtbares Werkzeug für Händler, die sich einen Vorsprung auf dem Markt verschaffen möchten.
Eines der herausragenden Merkmale des Awesome Oscillator Alert ist seine Kompatibilität mit allen Währungspaaren und Z

Hello my friends. This Expert Advisor is based on Ichimoku Kinko Hyo and Heiken_Ashi indicator. The input parameters are optimized for EURCAD H1. - magics = magic number - Lots = Lots - CloseMethod = Method to Close order - TP-SL-TSL (if set SL and TP = 0 it will open and close by signal) - MartinBuyOrSell = Open and Martingale oneway - MartinBuyandSell = Open and Martingale twoway - TP = take profit (point) - SL = stoploss (point) - tsl = trailing stop - martin_Plus =

Candlestick Patterns MT5 is a simple and convenient indicator able to define 29 candle patterns.
Advantages Defines and highlights 29 candle patterns; Estimated trading direction is shown as an arrow; Each candlestick pattern can be disabled in the settings; The indicator can be used as an arrow indicator in EAs.
Parameters TextSize - chart text size; TextColor - chart text color; Alert - enable/disable alerts; ---------- Candlestick Patterns ------------- - settings separator; AdvanceB

KT CCI Surfer uses a mean reversion trading strategy with a combination of extreme overbought/oversold zone detection using the Commodity Channel Index (CCI). Developed by Donald Lambert in 1980, CCI is a leading indicator that helps to identify the overbought/oversold region in the market without any lag.
Obviously, not every overbought/oversold signal turns out into a price reversal. However, when combined with a well-planned mean reversion strategy, it produces excellent results.
Recomme

News Trade is a semi-automatic EA that uses the two pending orders strategy, one above and one below the price, with a predefined distance between them.
Both follow the price untill the news moment, where they stop moving. After the price hit one of them the other is automatically canceled.
The trailing stop and step are applied and may also have the automatic partial closing. This EA is perfect for trading high impact news like Payroll, for example. You can test it on Strategy Tester with no
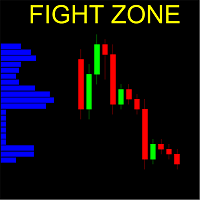
Vertical bar chart of candles!
What is it
This indicator creates a vertical bar chart of all visible candles corresponding to the amount of candles that the bars cross. The goal of this indicator is to easily check the places or regions where the candles concentrate. Those regions are a good place to place positions because they have a increased chance of staying more time there again.
It's hard to explain in words the exactly working of this indicator, we suggest you watch the video, it i

Main: Not martingale, not a grid; Working on all symbols;
Signals: There is a good rational algorithm. Work of two indicators: Bollinger Bands and OsMA (you can set a separate Timeframe for each indicator)
Stop Loss/Take Profit: There is a good money management system (there are several type for trailing stop loss); There is virtual levels of Stop Loss / Take Profit; There is smart lot (percent by risk) or fix lot
Important: EA can work on closed candles, and on current candles; Quick

ZoneFinder is an indicator panel that presents an interactive, multi-timeframe visualisation of trend direction and strength. Trend strength and direction is measured using a modified ADX indicator based on smoothed DI+ and DI- values. High probability trading zones are identified using Fibonacci retracements. Where such zones are found, they are marked on the chart together with a proposed Fibonacci targets.

Crazy Scalper mt5 Verrückter Scalper Crazy Scalper ist ein Nicht-Indikator-Handelsroboter, der ein Scalping-System verwendet, das gleichzeitig in zwei Richtungen handelt (Käufe und Verkäufe). Gleichzeitig können multidirektionale Positionen nicht profitabel sein und eine der offenen Positionen geht zwangsläufig verloren. Wenn es eine Verlierposition gibt, wird eine Sperre (Schloss) verwendet. Hat die Sperrposition wiederum ihre Funktion nicht erfüllt und der Quote reversiert, wird die Auszah
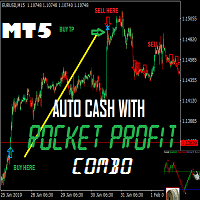
This is a great Metatrader5 Tool , which you can use Daily for your profitable Trading. The Accuracy is the best system you need to succeed in trading without stress. The signals doesn't repaint at all, alerts on bar close, and stays glued. The system works on MT5 and another version for MT4 also available.
What you get upon purchase:
-Lifetime support for the use of the system - Easy to use, clean user friendly interface with no single settings required - Arrow Signals showing where t
Der MetaTrader Market ist eine einzigartige Plattform für den Verkauf von Robotern und technischen Indikatoren.
Das Merkblatt für Nutzer der MQL5.community informiert Sie über weitere Möglichkeiten: nur bei uns können Trader Handelssignale kopieren, Programme bei Freiberuflern bestellen, Zahlungen über das Handelssystem automatisch tätigen sowie das MQL5 Cloud Network nutzen.
Sie verpassen Handelsmöglichkeiten:
- Freie Handelsapplikationen
- Über 8.000 Signale zum Kopieren
- Wirtschaftsnachrichten für die Lage an den Finanzmärkte
Registrierung
Einloggen
Wenn Sie kein Benutzerkonto haben, registrieren Sie sich
Erlauben Sie die Verwendung von Cookies, um sich auf der Website MQL5.com anzumelden.
Bitte aktivieren Sie die notwendige Einstellung in Ihrem Browser, da Sie sich sonst nicht einloggen können.