Neue Handelsroboter und Indikatoren für den MetaTrader 5 - 69
This robot is based on an MACD strategy for trending markets. The description of the strategy can be found on the attached youtube video. The video explains the strategy and shows a basic backtest and optimisation on a few symbols. It is advised to carry out a a backetst and optimisation of your own before using the robot. The video can be found at >> https://www.youtube.com/watch?v=wU_XCM_kV0Y  ;

Smart Market Scanner and Dashboard The trend is very important when trading a financial instrument. The trend can be identified by checking various of structures and indicators. Trend shifts can be identified by trendline breakouts and horizontal support/resistance levels. Scanner will scan the selected symbols and show you the direction/trend on selected timeframes. Algo is based on: Price Cycles, Fractals, Order Blocks, Hi-Lo
Advantages: Multi timeframe Multi instruments including Currencies

This tool is useful for indicating resistance and support levels It bases on zone in setting to identify top/bottom of candles and and draw rectangle according to those resistance/support level Beside user can edit the zone via dialog on specific timeframe and that value will be saved and loaded automatically. User can determine what strong resistance and support and make the order reasonably.
FREE

Gatotkaca Support Resistance Trendline Indicator is a simple indicator that detects support, resistance and trendlines. It will helps you find breakout momentum based on lines calculated by this indicator. This is conceptually based on fractals, but with customizable periods. Compatible for any timeframes. You can customize how this indicator work by setting up the period input.
FREE

RISK TO REWARD TOOL for MT5 with UI on chart: (creates similar RR boxes like on tradingview) -creates and deletes draggable boxes on chart, ANY SYMBOL, ANY TF. Menu buttons:
NEW BUY, NEW SELL, DELETE ALL, ( and minimize) -draggable target TP level
-draggable SL limit level
-text labels with pips SL TP, RR ratio-there is no limit of boxes
-but program remembers first 100 boxes after changing input. there is parameter "delete_on_init" so false = every created box stays as it is,

WHITE HORSE EA is a fully automated & customizable EA.
The EA's objective is to provide steady incomes with a high level of safeness .
FUNCTIONING :
The algorythm based on an auto-adaptive system, is constantly controlling the distance between orders.
The safeness is improved by 2 indicators : ADX and ATR
You can select your trading session ( Tokyo, London, New York)
You can select the news you want to trade (Low, medium or high impact)
STRATEGY:
- The curve
NEW: A Fully Automated strategy using price action and candle patterns to trade Gold (XAUUSD).
This EA can be used on any currency but recommended for XAUUSD, EURUSD and BTCUSD Safe stop loss option for FTMO and other funded accounts. REAL BACKTEST DATA - no manipulation or backtest conditioning like other EAs! 100% Modelling Quality Backtest! USE: Default settings on XAUUSD & XAUAUD on the M15 timeframe. Use ECN account for best results.
MAIN SETTINGS Setting Value Description
Automatic Expert Advisor. Night scalp system, with trend detection and pullback entry. Dynamic exit signal, for SL or TP. Every trade has fix SL. No usage of risky strategies like martingale, hedge, grid etc.
About EA Scalper strategy Technical strategy Can use with small deposits Pairs with best rezults: AUDNZD, AUDCAD, AUDCHF, EURAUD, GBPAUD, USDCHF, CADCHF, EURNZD, EURGBP, GBPCAD, GBPCHF, EURCHF Time Frame: M15 Recommendations Broker account with ECN and low spread Test it first to find out
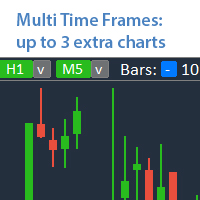
Analyze up to 3 additional charts of other timeframes , without switching the main chart. My #1 Utility : includes 65+ functions | Contact me if you have any questions The indicator opens in a separate window: The window can be moved to any place on the chart (using the [<M>] button). The window can also be minimized to save space ( [ <^>] button) In the window that appears, you can configure: The period of the 1st chart (left);
The period of the 2nd chart (center); The peri

GM Bounty Hunter MT5 is a fully automated/semi-automatic, The robot trades according to the overbought and oversold levels of the market. The EA's unique trading strategy has a high probability of winning. GM Bounty Hunter MT5 is optimized for use with low spread currency pairs. Info:
Working symbol XAUUSD, EURUSD, GBPUSD, USDJPY,.... Working Timeframe: M1, .....(The larger the timeframe, the more stable the signal) Min deposit $125 with Stop Loss settings (or equivalent in cents ) The minimu

В основе индикатора EasyBands лежит тот же принцип, что и при построении Bollinger Band. Однако, данная модификация индикатора использует вместо стандартного отклонения средний торговый диапазон (Average True Range). Соответственно, с данныи индикатором абсолютно аналогично можно использовать все стратегии, которые применяются с Bollinger Band. В данной версии индикатора используется двенадцать уровней и средняя линия (белый цвет). Индикация тренда выполнена в виде окраски свечей в зависимости
A technical Indicator Providing Price Convergence Signals along with value for experienced and professional traders. Easy to comprehend, Easy to understand.
This is a helping tool provides best signals. This indicator is designed based on the fundamentals of trade. A very good indicator you can customized its color. A best tool to find trade direction.
An adaptive indicator. It constantly adapts to the trade.

A value indicator for experienced and professional traders. It is helping tool to indicate the direction value gain. A best helping tool to trade value. This indicator is equipped with a colored line and a digital tool to indicate value numerically .
This indicator also helps to indicate value during trends. A study based on this indicator shows value of trade significantly changes during trends best tool to cash the trends.

Best helping tool for Professional and Experienced traders. A best Tool To find the trend. Instruction Manual: First Select your desired Symbol. Then attach this tool and wait till it identify the trend for you. Then it will be more feasible to trade.
Once again best tool to trade. Demo version is available you can fully test its functionality. More importantly there are always trend breaks Once Trend break is observed un-attach this tool and then re-attach to get the fresh trend. Precautions
A basic tool for traders to trade percentile of the value. It indicates both values in the for of digits appeared on the left corner of the screen.
Instructions Manual : First choose your desired symbol and then select this tool. Please be remined that this tool is just a helping tool. its upon trader what he chooses. The function of this tool is just to provide a help in trading.

OPTIMIZE For settings. SL and TP should Start with 50000 Important to get the optimization before backrest and use. I optimized on the last month option in the strategy tester. BTC Miner was build for trading BTCUSD on 1 hour time frames. About the EA and strategy: It uses ADX and Envelopes to enter trades and uses Momentum and Moving Average crossovers for exits. There is a fixed lot size and all trades have a SL and TP. The EA does not use martingale or hedging as its strategy, it is based
Две простых симметричных пробойных трендовых системы для лонгов и шортов, которые работают абсолютно независимо друг от друга. В основе алгоритма открытия позиций пробой ценой по тренду мувинга, сдвинутого по вертикали на фиксированное в настройках эксперта количество пунктов. Входные параметры эксперта разбиты на две большие группы: Для лонгов с префиксом "L";
Для шортов с префиксом "S". Поскольку в данном эксперте две торговые системы, то оптимизировать и тестировать их сперва следует отдель

Three Triple Exponential Average oscillators merged into one. Fast period will pull on the slower period, and the slower will smooth out the faster and avoid early positions. You can use 2 fast and 1 slow, or Fibonacci range or 2 slow, 1 fast. NOW FREE. But please consider supporting me by buying my 2 for sale indicators.
You can use this as an entry indicator and exit indicator. Open when the tripleTRIX line crosses the zero line and close when it starts to reverse. When the peaks get bigger,

Momentum Reversal ist ein leistungsfähiges Werkzeug, um mögliche Umkehrpunkte zu erkennen und Korrekturen zu starten, basierend auf einer Analyse der Intensität von Preisbewegungen und Barformationen.
_________________________________
So verwenden Sie die Indikatorsignale:
Der Indikator erzeugt ein Signal, nachdem ein neuer Preisbalken erscheint. Es wird empfohlen, das gebildete Signal zu verwenden, nachdem der Preis des kritischen Punktes in der angegebenen Richtung durchbrochen wurde. D
FREE

Market Palette ist ein leistungsfähiges Filterwerkzeug für Handelsentscheidungen, das auf Trägheit und Beschleunigung von Preisschwankungen basiert.
_________________________________
So verwenden Sie die Indikatorsignale:
Der Indikator erzeugt Histogrammsignale in drei verschiedenen Farben. Wenn blaue Spalten angezeigt werden, wird empfohlen, nur lange Positionen zu halten, wenn rote Spalten angezeigt werden, nur kurze Positionen, wenn graue Spalten angezeigt werden, und keine Handelsakti
FREE

Acceleration Points ist ein leistungsfähiges Tool zur Erkennung kritischer Preisbewegungspunkte, das auf der Idee basiert, die Beschleunigung von Preisschwankungen zu berechnen.
_________________________________
So verwenden Sie die Indikatorsignale:
Der Indikator erzeugt ein Signal, nachdem ein neuer Preisbalken erscheint. Es wird empfohlen, das gebildete Signal zu verwenden, nachdem der Preis des kritischen Punktes in der angegebenen Richtung durchbrochen wurde. Der Indikator zeichnet
FREE

Correction Breakthrough ist ein leistungsfähiges Werkzeug, um mögliche Breakout-Punkte aus einem Korrektur- oder Handelskorridor zu erkennen, basierend auf der Analyse von Preisformationen und der Trägheit von Kursbewegungen.
_________________________________
So verwenden Sie die Indikatorsignale:
Der Indikator bildet während des aktuellen Preisbalkens ein Signal. Es wird empfohlen, das gebildete Signal nach dem Schließen der Signalleiste oberhalb/unterhalb des Signalpfeils zu verwenden.
FREE

Points of Inertia ist ein leistungsfähiges Werkzeug zur Erkennung kritischer Preisbewegungspunkte, das auf der Idee basiert, die Trägheit von Preisschwankungen zu berechnen.
_________________________________
So verwenden Sie die Indikatorsignale:
Der Indikator erzeugt ein Signal, nachdem ein neuer Preisbalken erscheint. Es wird empfohlen, das gebildete Signal zu verwenden, nachdem der Preis des kritischen Punktes in der angegebenen Richtung durchbrochen wurde. Der Indikator zeichnet sein
FREE

Ein einfacher Expert Advisor für den Handel mit dem Währungspaar EUR / USD und nicht nur
Angetrieben von der BUX EA Engine
ENTSCHEIDEN.VAR: S1
Optimaler Satz von Indikatoren für die Signalerzeugung Öffnen/Schließen von Trades mit einem Signal/ ohne Signal, Pending Orders Martingal-Modus (einschließlich dynamischem Martingal) Virtueller Trailing Stop (für den Broker nicht sichtbar)
Verwenden Sie den Strategietester, um Ihre Handelsstrategie zu testen und zu optimieren
Alle notwendigen
Ein einfacher Expert Advisor für den Handel mit dem Währungspaar EUR / USD und nicht nur
Lite-Version von BUX SOLO
Angetrieben von der BUX EA Engine
ENTSCHEIDEN.VAR: S1 (OPT.VER: S1)
Optimaler Satz von Indikatoren für die Signalerzeugung Öffnen/Schließen von Trades mit einem Signal/ ohne Signal, Pending Orders Martingal-Modus Virtueller Trailing Stop (für den Broker nicht sichtbar)
Verwenden Sie den Strategietester, um Ihre Handelsstrategie zu testen und zu optimieren
Alle notwendi

Zeigt die aktuelle Hauptmarktsitzung und die verbleibende Zeit bis zum Beginn der nächsten an.
Märkte
New York London Frankfurt Tokio Sidney 1 weitere Sitzung mit benutzerdefiniertem Namen, Öffnungs- und Schließzeit
Uhrzeit
GMT / UTC Lokal (vom Computer) Broker (Serverzeit) Die Standardzeit in den Einstellungen ist GMT. Nach dem Wechsel zur lokalen oder Broker-Zeit ist es erforderlich, die Öffnungs- und Schließzeiten jeder Sitzung basierend auf dem ausgewählten Zeittyp manuell anzupassen.
FREE
Demo version of the Virtual SL TP Trailing product for testing all functions https://www.mql5.com/ru/market/product/75210
ВНИМАНИЕ: ТОЛЬКО ДЛЯ ДЕМО-СЧЕТОВ !!!
Make Trailing Stop, Take Profit, Breakeven, Stop Loss levels invisible to the broker!
HIDDEN MODE (STEALTH MODE) Virtual Trailing Stop (Virtual Trailing Stop) Virtual Take Profit (Virtual Take Profit) Virtual Breakeven (Virtual Breakeven) Virtual Stop Loss (Virtual Stop Loss) Виртуальный 2-уровневый Трейлинг-стоп Virtual
FREE
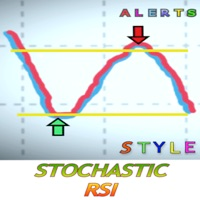
Was ist der stochastische RSI?
Der stochastische RSI (StochRSI) ist ein Indikator, der in der technischen Analyse verwendet wird. Er bewegt sich zwischen null und eins (bzw. null und 100 bei einigen Charting-Plattformen) und wird durch Anwendung der Stochastik-Oszillatorformel auf eine Reihe von Relative-Stärke-Index-Werten (RSI) und nicht auf Standardkursdaten erstellt. Diese Version enthält Warnungen, damit Sie keine wirklich guten Gelegenheiten verpassen. Sie legen den Parameter fest, wann

Martingal. „Oberon iSAR MT5“ besteht aus 15 separaten Blöcken (Mini Expert Advisors), die den Gewinn summieren und den Drawdown über die Zeit verteilen.
Besonderheiten: Individuelle Eingabedaten für jedes Zeichen. Symbole können wiederholt werden (sogar 15 identische werden getrennt voneinander gehandelt). Auf einem Handelskonto können Sie mehrere „Oberon_iSAR_MT5“ mit unterschiedlichen Einstellungen installieren (Bedingung beachten: Magic[i+1]>Magic[i]+15). Installiert auf einem beliebigen D

M & W Pattern Pro is an advanced scanner for M and W patters , it uses extra filters to ensure scanned patterns are profitable.
The indicator can be used with all symbols and time frames.
The indicator is a non repaint indicator with accurate statistics calculations.
To use , simply scan the most profitable pair using the statistics dashboard accuracy , then enter trades on signal arrow and exit at the TP and SL levels.
STATISTICS : Accuracy 1 : This is the percentage of the times price hit

本指标 基于 Zigzag 基础上... 增加了: 1.增加了箭头指示,使图表更鲜明 2.增加了价格显示,使大家更清楚的看清价格. 3.增加了报警等设置,可以支持邮件发送 原指标特性: 1.基本的波段指标构型. 2.最近的2个ZIGZAG点不具有稳定性,随着行情而改变,(就是网友所说的未来函数) 3.原指标适合分析历史拐点,波段特性,对于价格波动有一定的指导性.
Zigzag的使用方法一 丈量一段行情的起点和终点 (1)用ZigZag标注的折点作为起点和终点之后,行情的走势方向就被确立了(空头趋势); (2)根据道氏理论的逻辑,行情会按照波峰浪谷的锯齿形运行,行情确立之后会走回撤行情,回撤的过程中ZigZag会再次形成折点,就是回撤点; (3)在回撤点选择机会进场,等待行情再次启动,止损可以放到回撤的高点。 一套交易系统基本的框架就建立起来了。 Zigzag的使用方法二 作为画趋势线的连接点 趋势线是很常见的技术指标,在技术分析中被广泛地使用。 但一直以来趋势线在实战中都存在一个BUG,那就是难以保证划线的一致性。 在图表上有很多的高低点,到底该连接哪一个呢?不同的书上画趋势线的方
FREE

Gann 9+ Indicator Introduction The "Gann Matrix Chart" is the most simple and clear technical analysis in Gann theory, which is the calculation tool that Gann has always been committed to using. It is the essence of Gann's whole life. The Gann 9+ indicator uses the matrix chart to find the future high or low points of stocks or futures. Indicator Input: The base and step size can be set as 1 by default; When the multiple is -1, the multiple will be automatically obtained, or it can be filled in

Market Profile 3 MetaTrader 5 indicator version 4.70— is a classic Market Profile implementation that can show the price density over time, outlining the most important price levels, value area, and control value of a given trading session. This indicator can be attached to timeframes between M1 and D1 and will show the Market Profile for daily, weekly, monthly, or even intraday sessions. Lower timeframes offer higher precision. Higher timeframes are recommended for better visibility. It is als
FREE

Of all the tasks that a trader faces when entering a market, the main task is to determine the direction of the trend. The Artificial Power indicator will help you with this task. Whatever goal the trader sets for himself, the tool to achieve it will be mainly trend indicators.
The Artificial Power indicator without delay and redrawing is used by traders in trend strategies in trading on financial markets (Forex, CFD, binary options). This indicator is designed to detect trends in price movem

Flag Pattern pro is a Price Action (PA) analytical tool that scans the continuation patterns known as "Flag and Pennant Patterns" .
Flag and Pennant patterns are continuation patterns characterized by a move in a previous trend direction after a shallow retracement usually below 50% of the original move . Deep retracements can however be sometimes found at the 61.8 % levels. The original move is know as the flag pole and the retracement is called the flag.
Indicator Fun

This is a buyer and seller aggression indicator that analyzes the shape of each candle and project this data in a histogram form. There are 4 histograms in one. On the front we have two: Upper - Buyer force. Lower - Seller force. At the background we also have two histogram, both with same color. They measure the combined strenght of buyers and sellers. This histograms can be turned off in Input Parameters. It is also possible to have the real or tick volume to help on this force measurement. IN
FREE

The currency strength momentum has a lot of similarities with currency strength meter presented in the previous page, but the difference are much more pronounced. You can try putting both in the same chart and see the difference in results. Currency strength momentum measures strength of a currency based on (you guess it) it's momentum relative to other currencies, while currency strength meter measures the strength of a currency based on pips it has moved in a certain direction.
FREE

Have you ever wondered which currency is the strongest at any particular time? Or which currency pair is trending the most. Well, the currency strength meter helps with just that. It compares USD , EUR , AUD , CHF , GBP , CAD and NZD depending on the timeline you have chosen in settings, and ranks them on the number of pips each has moved compared to the rest. N/B: All currency charts of the above pairs must have loaded. You can do this by highlighting all major and minor currencies in
FREE

Presentation
Another indicator that makes scalping on tick charts easier, it displays an Heiken Ashi graph in Ticks.
It allows to detect entry points and trend reversals. Recommended number of ticks in a candle : 5, 13 or 21.
Parameters Ticks in candle: Number of ticks in a candle (default 5), Displays Trend arrows : displays a trend arrow based on EMA8 and EMA20 crossing, Displays MM50, Displays MM100, Max Candle (CPU): number of candles max to manage, low value will save ressources of
FREE
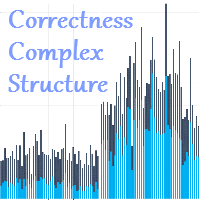
The Correctness Complex Structure indicator displays the complex structure of the bar, taking into account tick volumes in digital terms. How to interpret the information provided by the indicator. It's very simple, it's enough to analyze the chart. We will explain the work using an example, take the EURUSD instrument on the D1 timeframe, install this indicator and analyze the information provided by the indicator. The indicator works in the bottom of the chart and gives the result in the form
CalcFlat Creative is a flat indicator.
This is a more advanced version of the CalcFlat indicator. Three lines have been added for this indicator, which significantly improve the performance of the predecessor indicator. In addition to the two existing levels that the user reacted to and which were static, now the indicator has three dynamic lines on top of the main chart and interpreted as: signal line base, signal minimum, signal maximum.
These lines are formed due to the additional indica

This indicator is very useful in observing the direction of the market. It allows users to enter multiple MA lines with specific display method. In addition, it is also possible to change the candle color same to color of the background of chart, so that we only focus on the MA lines. When a signal appears, represented by a red or green dot, we can consider opening a sell (red dot) or buy (green dot) order. Note: it need to set stoploss at the highest value of MA lines (with sell order) or lowe
FREE

This indicator combines RSI(14) and ADX(14) to find out the signal that price moves strongly. When it appears signal (represent by the yellow dot), and price is going down, let consider to open a SELL order. Otherwise, let consider to open a BUY order. In this case, the strength of moving is strong (normally after sideway period), so we can set TP by 3 times of SL .
FREE

BPS BoS - Break of Structure
BoS - Fractal mode , MTF
BoS - Zigzag mode , MTF
Show HH and LL
Alerts - Popup , Push notification and eMail Option to create screenshot on alert Enable / Disable Indicator with a button on chart to select options
Choose corner of button location
It is not a system but a indicator to help identify break of structure points
MT 4 Version : https://www.mql5.com/en/market/product/78420?source=Site+Profile+Seller Other Indicators : https://www.mql5.com/en/use

Description :
A utility to create and save screenshots automatically and send to a chat/group/channel on telegram.
The saved/sent image file will include all objects that exist on the chart and also all indicators are displayed on the chart.
Features: Save screenshot of chart including all objects, indicators, ... Send screenshots to a telegram chat/group/channel
Wide range options to select when create screenshots
Logo and text adding feature
Inputs and How to setup the EA :
Variou

Trendlinien sind das wichtigste Werkzeug der technischen Analyse im Devisenhandel. Leider zeichnen die meisten Händler sie nicht richtig. Der automatische Trendlinien-Indikator ist ein professionelles Tool für ernsthafte Trader, das Ihnen hilft, die Trendbewegung der Märkte zu visualisieren.
Es gibt zwei Arten von Trendlinien Bullische Trendlinien und Bärische Trendlinien.
Im Aufwärtstrend wird die Forex-Trendlinie durch die niedrigsten Swing-Punkte der Preisbewegung gezogen.
Wenn man m

Martingal. Der Expert Advisor „Constructor_Simple_MT5“ besteht aus 5 separaten Expert Advisors , die gleichzeitig und unabhängig voneinander arbeiten: Barhandel. Handel mit iEnvelopes-Indikatoren. Handel mit dem iMA-Indikator. Handel mit dem iIchimoku-Indikator. Handel mit dem iSAR-Indikator. Der „Constructor_Simple_MT5“ Expert Advisor ist eine vereinfachte Version des „Constructor_MT5“ Expert Advisor. Die Anzahl der Eingabeparameter wird auf ein Minimum reduziert, was sowohl die Verwendung d

Dabei handelt es sich um einen indikator für trends, der mittels eines rot-grünen realstranges die änderungen des börsenpreises widerspiegelt, wobei eine änderung der realfarbe auf einen möglicherweise umkehrbaren gang des kurses hindeutet, der bereits auf den markt überhand genommen hat. Die grüne linie zeigt marktkurse an, wenn sie im steigen sind, die rote linie zeigt marktkurse an, wenn sie fallen.
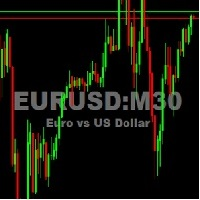
This utility tool shows the ticker symbol, timeframe, and description information as a watermark on the chart. Text resizes automatically according to chart size. It is useful to identify the correct chart when multiple charts are shown on the screen. Want more control over text apperance? Check out our Chart Watermark MT5 Premium utility. See the demonstration video below!
Inputs: Font Size: Initial font size for the ticker symbol and timeframe text (Default; 50). Description text font siz
FREE
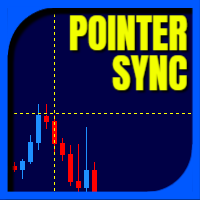
Pointer Sync is a pointer synchronizer between open charts. It makes the MT5 cross (activated by the middle mouse button) to be replicated on all open charts. In addition, it is possible to create horizontal lines (letter H) and vertical lines (letter V), very useful for studying. The appearance of the lines is customizable. Note: Synchronization is through the X and Y scale in pixels , not price and/or date. It is a simple and free utility. Enjoy!
This is a free indicator, but it took hours t
FREE

Ilan is a well known algorithmic trading system with its advantages and inconveniences. He is reputed to have good results when the prices are in a range but also to blow up the accounts in the case of strong trend. From a basic Ilan system, I added a trend filter to detect range periods, so that it trades only during these periods. I have also added a feature allowing it to adapt to economic news, it will not trade from one to several hours before and after a news depending on its importance. O
TDO is a free utility for optimizing the Trading Direction indicator. In addition to signals for trading, the indicator also has an information vector that fully provides all the statistical information on the operation of the indicator; this effect can be used to ensure that the indicator is automatically optimized. You just need to select the instrument and timeframe and specify the hourly interval in the utility settings and drop it on the chart chart. That's all, now we are waiting for the
FREE

Overlay indicator on chart between 2 pairs
The Timeframe Overlay indicator displays the price action of timeframes on a single chart, allowing you to quickly assess different timeframes from a single chart. The advantage is to observe and follow the correlations of price movements in real time to help you find potential trades at a glance.
---- Symbol 1 ----
Symbol = EURUSD
Correlation Inverse = false
Display = true
Ratio
FREE
Are You Better than Monkey? Prove it...
The trade of this EA is based on random output with customizable lot size (use martingale or not), stop-loss, and take-profit levels. Easy to use and Simple Great for benchmarking tests against other EAs or manual trade. Works for ECN/Non-ECN brokers and 2-3-4-5 digit symbols Support us by open My recommended broker. Exness Tickmill robot monkey uses Adx trend filter for fair game no-trade unfavorable market ( you can turn off set adx = 0) . EA starts
FREE

Dear friends, I finally found enough time to focus on developing the new version 1.10 of the "Lion King" robot. This is a completely new robot with an integrated neural network and a reduced number of signals. I've added all the fancy features I thought would be helpful, bringing the system to its utmost potential. I took this step because I sold several licenses over two years ago, but the system wasn't good enough. Now, I can guarantee the performance of this system. The system is designed to
The new Royal Prince Master Non-Repaint Indicator MT5 has two control points ? What does this mean it allows you to use two different indicators to cross to see to find your signals, those two indicators also can be customized just like if you were to load them individually on a chart.
Want to see the indicator in action check the youtube video.
ALSO IT HAS ALERTS !!!!!
List of Different indicators to choose from :
1) Moving Average 2) Moving Average Convergence/Divergence 3) O

The result is visible in the first hours of operation!
The bot opens a grid of orders with a minimum lot. And it fixes a small profit, but it does it very often. Thus, the profitable zones
are always close to the current price.The Expert Advisor has a trading panel. With it, you can open positions that will be picked up by the Expert Advisor and taken into account in trading. The built-in switchable filter ensures trading in the direction of the trend.
Use a $ 1,000 depo

This indicator provides several drawing tools to assist in various methods of chart analysis.
The drawings will keep their proportions (according to their handle trendline) across different chart scales, update in real time, and multiple drawings are supported.
#
Drawing Option
Description
1 Grid box draggable boxed grid, user defines rows x colums, diagonal ray option 2 Grid partial or fullscreen grid, sized by handle line 3 Grid flex a diagonal grid, sized and sloped by handle line

STARGOGS PRICE ACTION EA ABOUT: This Robot is based on Price Action mostly Trendlines and Support & Restistance. The Robot Also uses 2 Strategies which you can choose from by choosing which one to use (True/False) Strategy 1: One Entry at a time with Fixed TP and SL. Strategy 2: Grid and Matingale. You can also use this EA as a Indicator by Turning Trading off also by using (True/False). You can aslo use Lot multiply on loss if you want or use fixed lotsize. MINIMUM BALANCE:
The Minimum Balan

Relative Volume or RVOL is an indicator that averages the volume of X amount of days, making it easy to compare sessions volumes.
The histogram only has 3 colors:
Green - Above average volume
Yellow - Average volume
Red - Below average volume
The default setting is 20 days, which corresponds more or less to a month of trading.
In this version is possible to choose between tick and real volumes (if you are using a broker which offers future contracts)
With the data obtaine
FREE

This indicator provides common shapes as drawing object options. The shapes are rotatable, resizable, draggable, and will keep their proportions (according to their handle trendline) across different chart scales. Multiple drawings are supported.
Shapes: Square Rhombus
Triangle (quadrilateral & isosceles) Circle (grid, overlapped grid, flexi grid, rotatable grid, concentric circles) Features: rays (all object edges will be rays) show/hide each individual drawing type, or all delete last drawn
FREE

--- Last 5 copies left free. Next there will be a price 30$ ---
DRAGON SWING EA (for EUR/USD 20 minutes) NO MARTINGALES NO CUMULATE ORDERS NO PARTIAL CLOSURES OR HEDGING NO CONFUSIONAL PARAMETERS, MULTI-CHARTS OR MULTI TIMEFRAME NOT OVER-FIT OR COMPLICATED AND RISKY STATEGIES THAT CRASH AFTER FEW DAYS
This is a healty, simple, durable and solid Expert Advisor. Suitable and simple to use also for beginners with little capital.
DESCRIPTION: The strategy of this expert advisor is to operat

It is an Expert Advisor who uses the famous Dave Landry strategy, widely used to operate swing trades in various types of markets, Forex, B3, indices, stocks and cryptocurrencies.
The Dave Landry Setup is one of the most well-known setups that operate in favor of the trend, there is a preference for the larger H4, Daily, Weekly and Monthly timeframes, due to its high hit rate, but the TsuTrader Dave Landry robot allows complete customization of the strategy .
- TSUTrader Dave Landry is the
--- ! Last 8 copies left free. Next there will be a price $30 ! --- DRAGON RALLY SNIPER EA (USD/JPY 5min) NO MARTINGALES NO CUMULATE ORDERS NO PARTIAL CLOSURES OR HEDGING NO CONFUSIONAL PARAMETERS, MULTI-CHARTS OR MULTI TIMEFRAME NOT OVER-FIT OR COMPLICATED AND RISKY STATEGIES THAT CRASH AFTER FEW DAYS DESCRIPTION: The idea behind this system is very simple: identifies break-outs in price levels and starts trade on the pull-backs . It works perfectly on the USD/JPY cross with a 5-minute tim
This EA trails your stops based on percentage of current TP, for both manually and auto-opened trades. You can edit the percentage value in the inputs. Trailing stop is a more flexible variation of a normal exit order. T railing stop is the practice of moving the stop-loss level closer to the current price when the price moves in your favor. Trailing the stop-loss allows traders to limit their losses and safeguard their positive trades. It is a very popular practice. This EA will manage you
Multi-Timeframe Chart Overlay Indicator
The Timeframe Overlay indicator displays price action for multiple timeframes on a single chart, allowing you to quickly assess different timeframes from a single chart. The advantage is to observe and follow the correlations of price movements in real time to help you find potential trades at a glance.
---- Symbol 1 ----
Symbol = EURUSD
Correlation Inverse = false
Display = true
Ratio
Divergence is one best ways to trade the financial market as it is a leading indicator of price action that detect high probability reversal and continuation setups. The AlgoKing Divergence Detector is an RSI and Stochastics Indicator with Divergence Detection. Features Hidden Divergence for trend continuation. Standard or Normal Divergence for trend reversal. Screen Alerts. MetaQuotes Notifications. Email Notifications. RSI Indicator built in. Stochastics Indicator built in. Types of Divergen
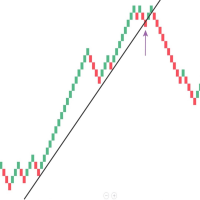
Mean Renko Bars are used for alternate price charting. Unlike the usual time framed chart – where every candle represents a fixed time interval – the goal of Renko chart is to display price movement in increments, called bricks. Best with the momentum strategies. Can make some Algo with this candel ---- ---- ---- ---- ---- ---- ---- ---- ---- ---- Support: primecapitalvn@ gmail. com
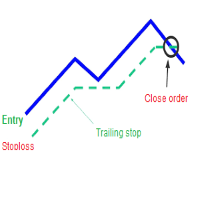
A trailing stop loss is a type of day-trading order that lets you set a maximum value or percentage of loss you can incur on a trade . If the security price rises or falls in your favor, the stop price moves with it. If the security price rises or falls against you, the stop stays in place. With this version, you can run trailing stoploss with currencies (ex start when profit more 1$, trailing stop with 2$...)

Achtung Händler – Um Geschenke nach dem Kauf zu erhalten, schreiben Sie mir in einer privaten Nachricht! Sie erhalten nach dem Kauf: Indikator Handelspanel Zugang zum VIP-Chat Ein Monat Zugriff auf den Kanal über Signale. Einzigartige Einstellungen Iron Man ist ein leistungsstarker Handelsalgorithmus, der für den automatisierten Handel auf den Finanzmärkten entwickelt wurde. Dieser Berater umfasst 25 Handelsmuster, die zur Entscheidungsfindung über den Ein- und Ausstieg aus Positionen verwendet
Der MetaTrader Market ist eine einzigartige Plattform für den Verkauf von Robotern und technischen Indikatoren.
Das Merkblatt für Nutzer der MQL5.community informiert Sie über weitere Möglichkeiten: nur bei uns können Trader Handelssignale kopieren, Programme bei Freiberuflern bestellen, Zahlungen über das Handelssystem automatisch tätigen sowie das MQL5 Cloud Network nutzen.
Sie verpassen Handelsmöglichkeiten:
- Freie Handelsapplikationen
- Über 8.000 Signale zum Kopieren
- Wirtschaftsnachrichten für die Lage an den Finanzmärkte
Registrierung
Einloggen
Wenn Sie kein Benutzerkonto haben, registrieren Sie sich
Erlauben Sie die Verwendung von Cookies, um sich auf der Website MQL5.com anzumelden.
Bitte aktivieren Sie die notwendige Einstellung in Ihrem Browser, da Sie sich sonst nicht einloggen können.