

Break and Retest is one of our most complex indicators ever created with over 1,400 lines of coding. It's easily one of the best strategy you can have in your trading tools because it's based on pure price action!
⚠️ To make sure that Break and Retest works properly, here is what you need to see at the top left of your MT4 chart:
Health: Working Ok...
Status: Scanning for a Break & Retest entry...
What is Break and Retest?
The key idea behind our Break and Retest strategy is to wait for the price to break through a support or resistance level, and then go back to that level, to retest it. Now, before entering the trade, our indicator looks for wick rejections indicating that traders are actively defending this retest level. After successfull wick rejections, we wait for the candle continuation to finally get buy & sell signals telling us to enter the trade!
Usually when there is a trend, there is always retest levels before the market continues the trend. We wait for traders to reject the retest level to show us a sign that they want to continue with the trend and not break it. When we have several rejection signs at the retest level, we wait for the candle continuation to form before entering the market with a trade! Here is an example:
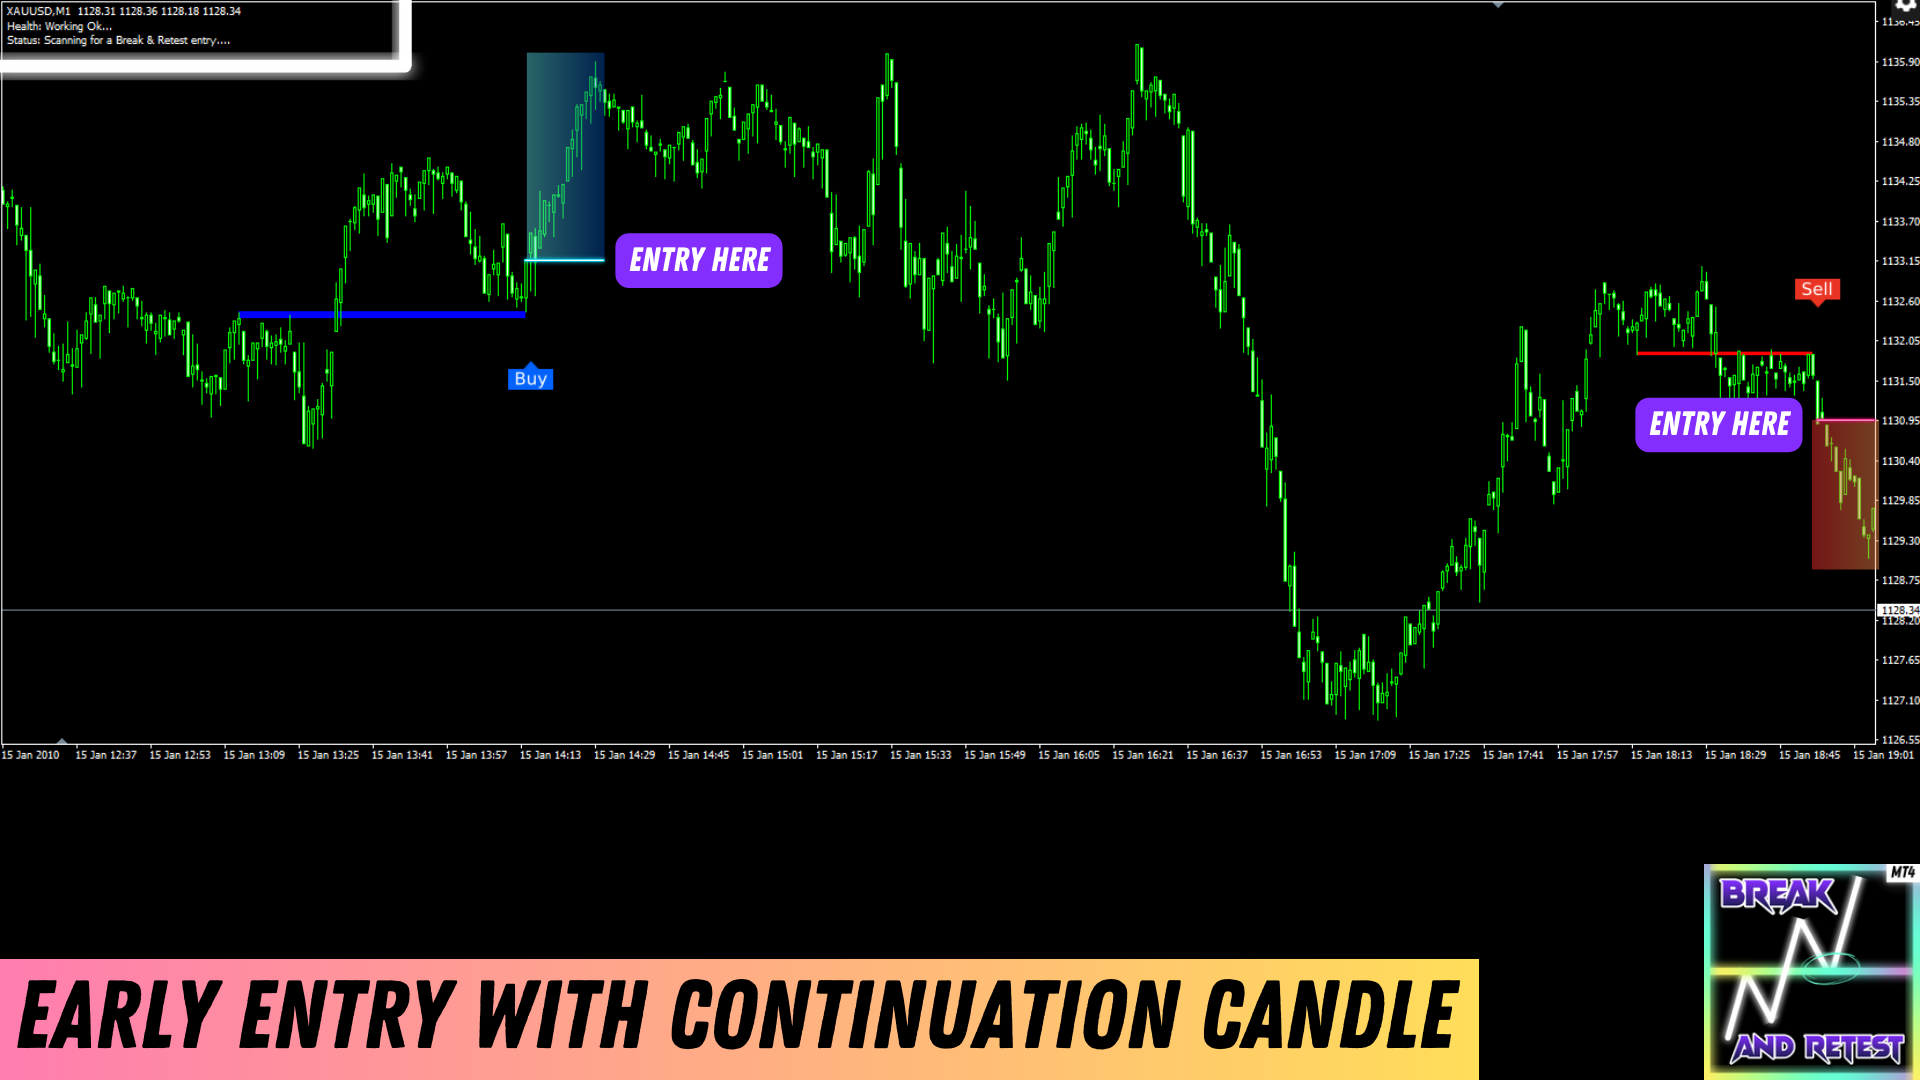
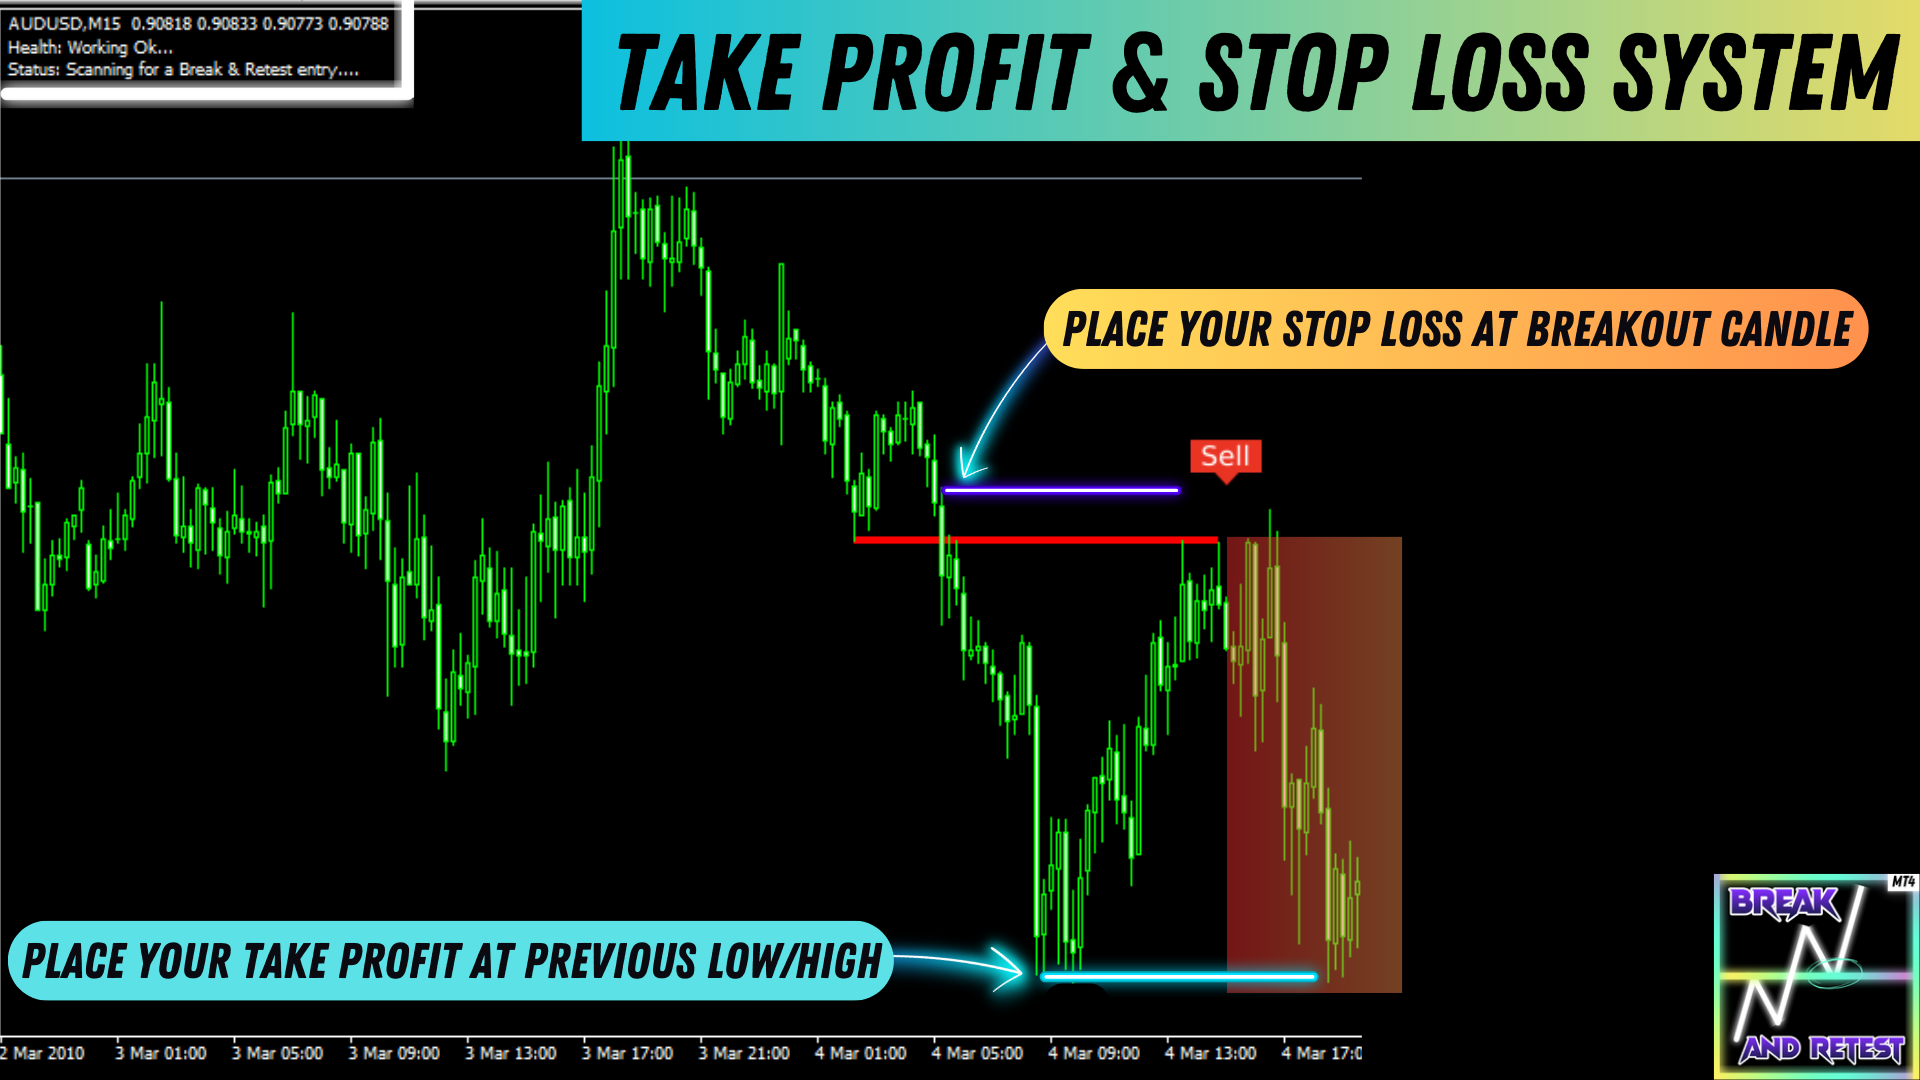
When we see that there is a continuation candle moving away from the retest zone in the direction of the main trend, we enter our trade! Once you enter the trade, you need to know your take profit and stop loss level. For our stop loss, we usually place our stop loss at the breakout candle that broke the support and became an new resistance zone. For our take profit, we usually place our take profit at the previous low or previous high candle. Here is an example:
Break and Retest Parameters
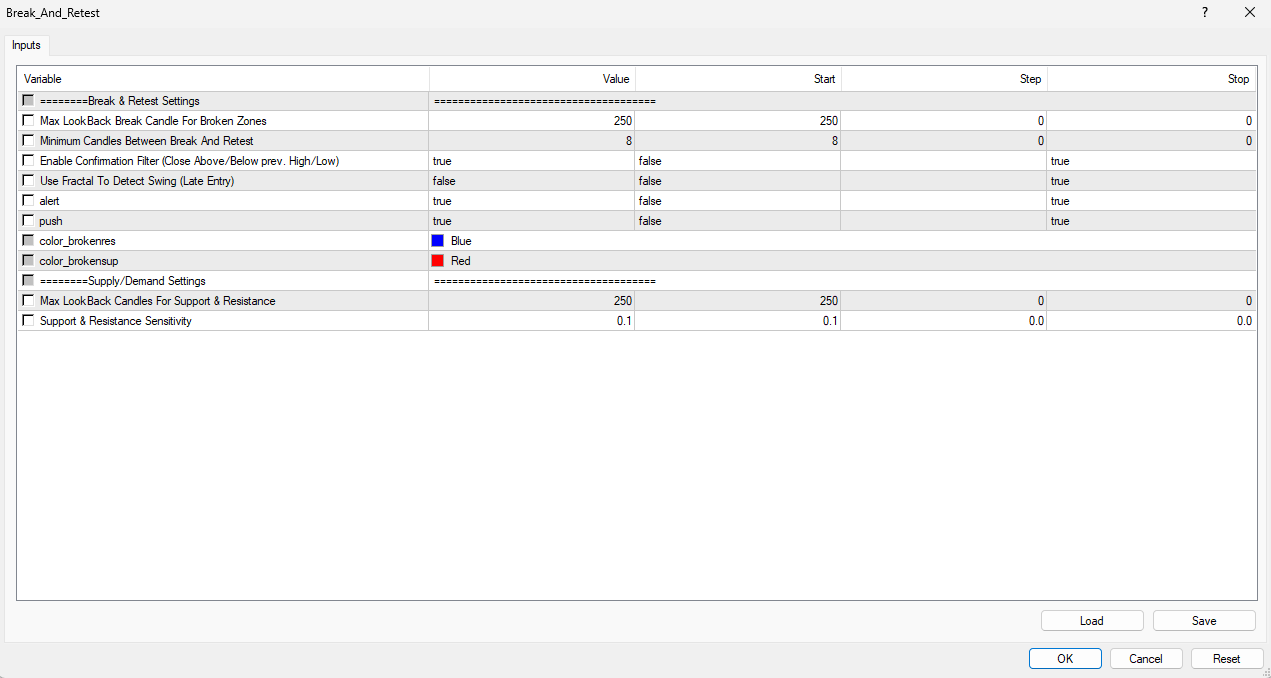
When you attach Break and Retest to a chart, here is the main settings that will pop-up. Find below the explanation of each input:
Break & Retest Settings
- Max Lookback Break Candle For Broken Zones: 250 by default. How many previous break candles do you want the indicator to remember for a possible retest.
- Minimum Candles Between Break And Retest: 8 by default. What is the minimum candles required between a break and a retest. Higher number gives more room for clear retests.
- Enable Confirmation Filter (Close Above/Below prev. High/Low): True by default. True means that when there is a retest, indicator waits for the confirmation candle after the wick rejection.
- Use Fractal To Detect Swing (Late Entry): False by default. If set to true, after a retest, the entry signal will appear after several confirmation candles. Fractal means that we wait to have the highest high or lowest low of the candlesticks. This means that you will enter your trade after a late retest.
- Alert: True by default. When a new signal appears after a retest, you will get a notification for either buy or sell in your MT4 terminal.
- Push: True by default. When a new signal appears after a retest, you get a push notification in your phone from the Metatrader 4 app.
- color_brokenres: Blue by default. Here, you can change the color of your resistance zones.
- color_brokensup: Red by default. Here, you can change the color of your support zones.
- Max LookBack Candles For Support & Resistance: 250 by default. How many candles far back from the actual price do you want the indicator to memorize the support and resistance zones. It would make sense to lower this number if you're trading on smaller timeframes and make it higher when you're trading higher timeframes. However, 250 is a one size fits all solution for all timeframes so you don't need to change that!
- Support & Resistance Sensitivity: 0.10 by default. This is the thickness of the support and resistance zones. If you want a thin line, you can lower the number to 0.07 per example. If you want a thick line, you can increase the number to 0.20 per example. We selected 0.10 by default because we personally feel like it's the perfect line width. This parameter can definitely be tweaked for your trading purposes!
The break and retest strategy works on any timeframe. By default, the indicator uses a max lookback of 250 candles and a break lookback of 250 candles which is a one size fits all solution for any timeframe. However, if you want to sharpen even more your trading skills, we recommend trying our set files (attached below) for each timeframe! Here is how it changes from the default settings:
- M1: 50 candles
- M5: 100 candles
- M15: 150 candles
- M30: 250 candles
- H1: 250 candles
- H4: 500 candles
- D1: 1,000 candles
- Weekly: 2,000 candles
- Monthly: 4,000 candles
In order to use the set file on each timeframe, you need to click on the load button in your indicator settings:

How to spot a good break and retest from a bad one?
When there is a retest that occurs on the support or resistance zone, you need to visually see that this new zone hasn't been broken below or above the levels. If the zone is broken by candles or even wicks, this simply shows that the zones are not even good candidates for a retest. You wait for another setup. Here is an example between a good retest and a bad one:
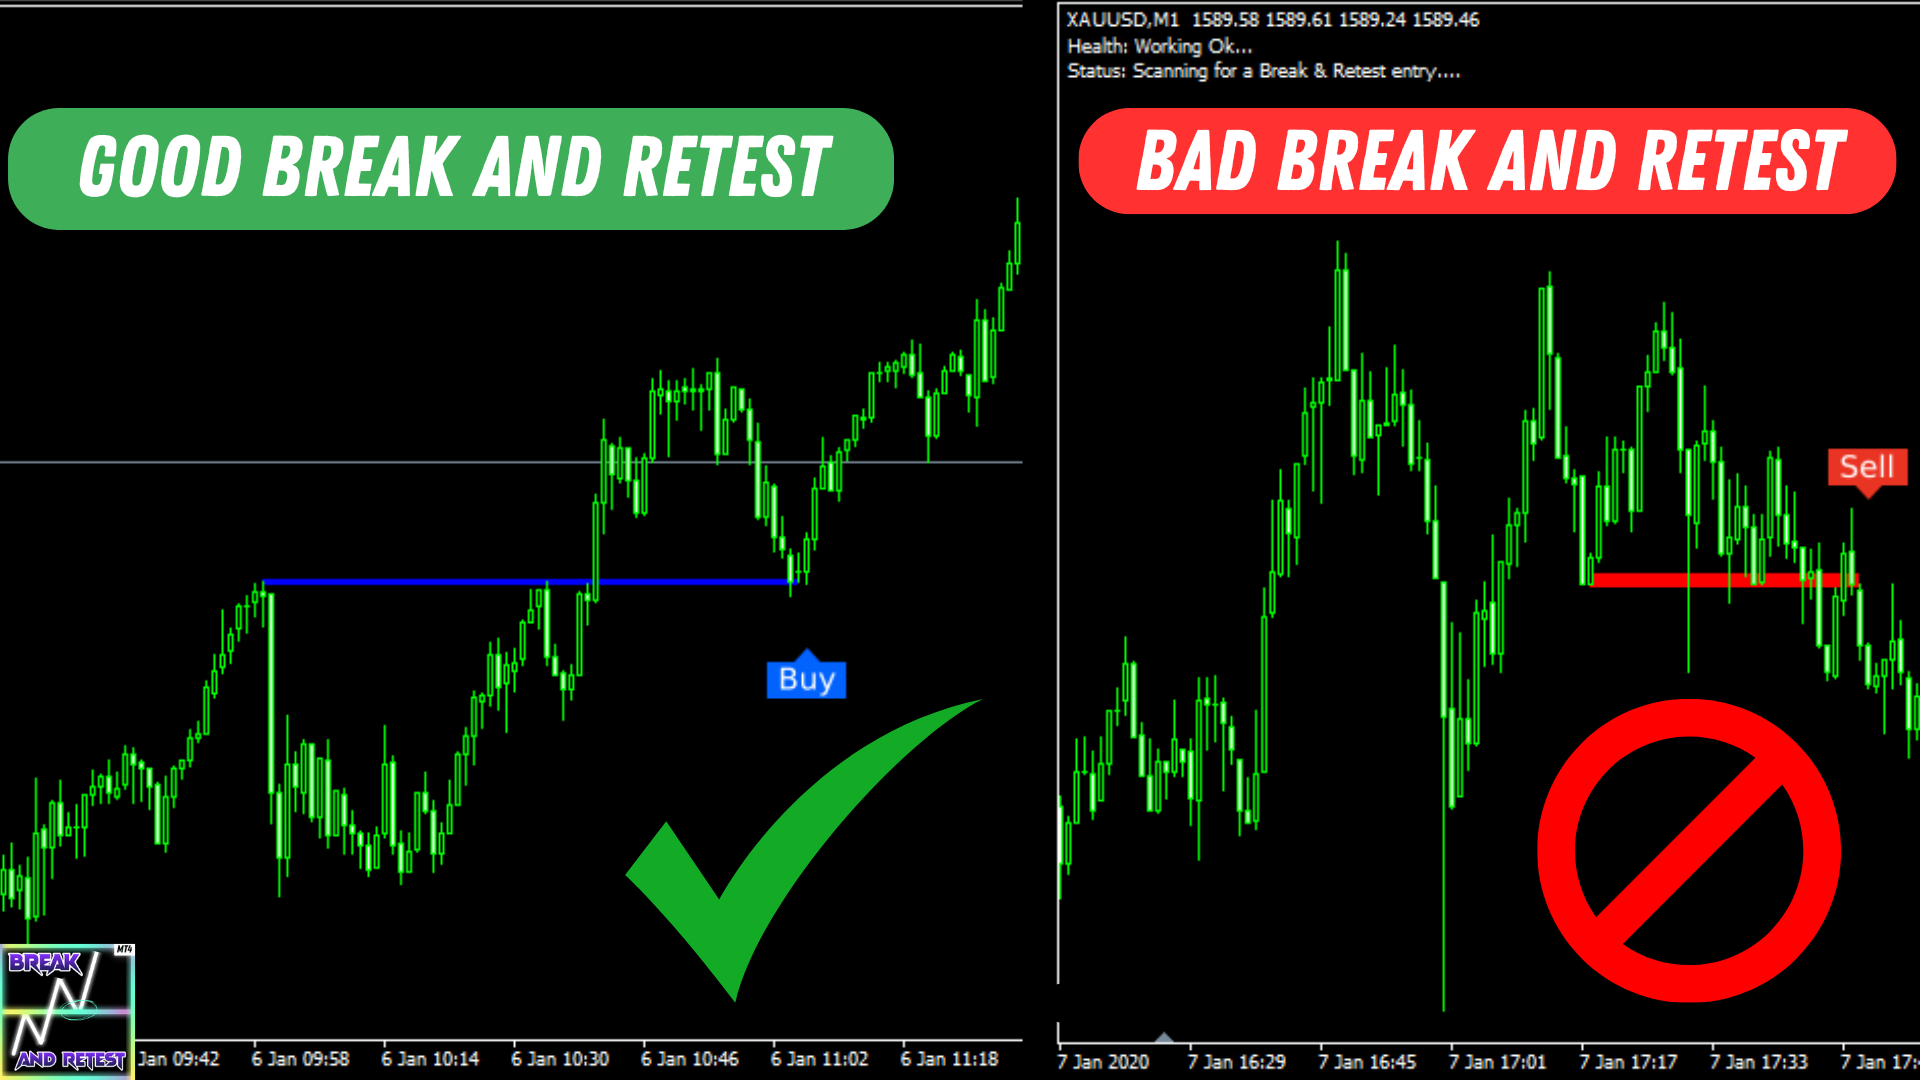
✅ On the left side of the picture, this is a good retest because the new support zone hasn't been broken before the retest alert. Yes there can be some consolidation candles around the retest zone, as long as these candles didn't break the support or resistance zone. Consolidation is a good sign because it shows that traders are defending the current level. We wait for the continuation candle and then we enter the trade based on the alert given by the indicator.
⛔ On the right side of the picture, this is not a good retest. It's a bad one because the resistance zone was already broken by several wicks before getting the retest alert. Even if the market went down, I wouldn't enter this trade because I need to see a clear resistance zone that hasn't been broken before the retest. It clears out any doubts regarding the level itself and makes you trade with more confidence!
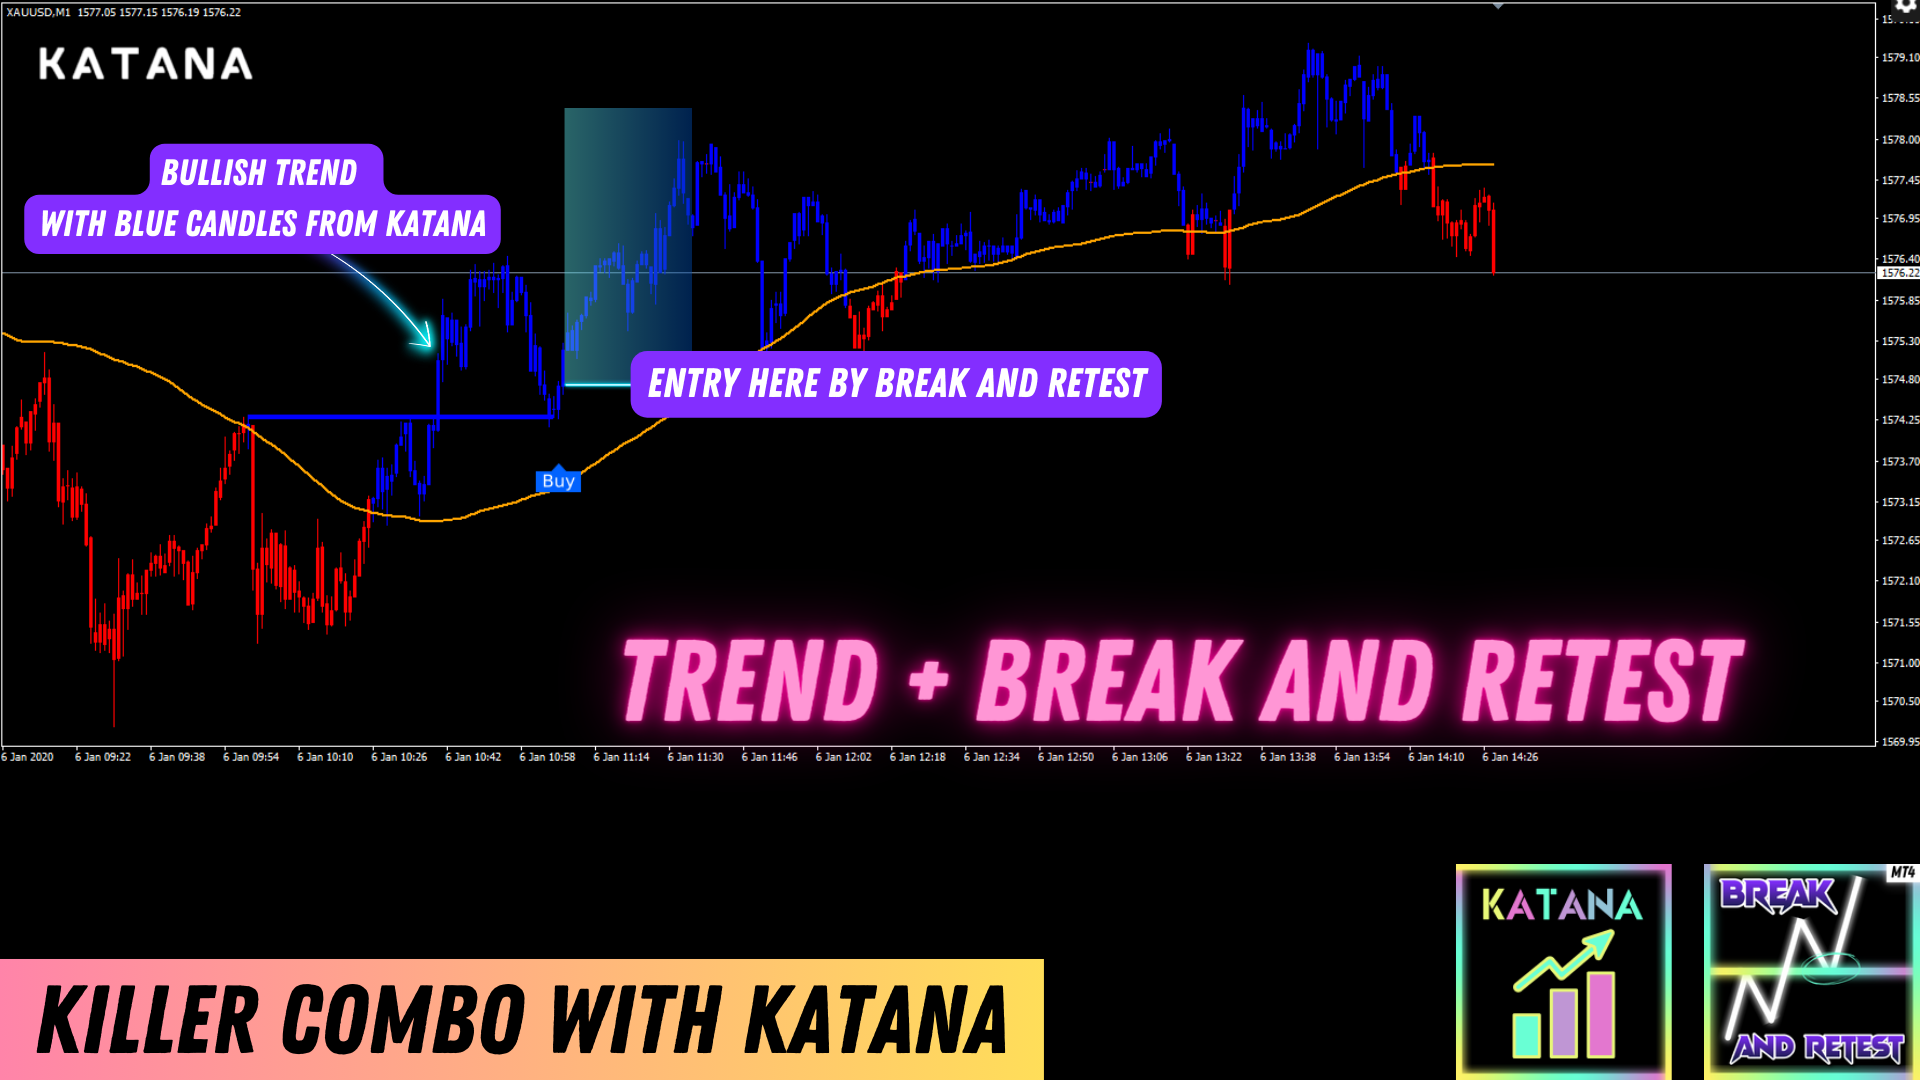
How to trade Break and Retest with the Trend?
If you want to be a master in trading, you need to remember that trend is always your friend! When a Break and Retest happens, you want to make sure that you're on the right side. That's where our Katana indicator comes in handy. Katana gives you the main trend by using moving averages. If Katana visually shows you an uptrend while Break and Retest gives you a buy signal, it's the time to enter a trade thanks to these 2 powerful indicators!
Here is an example:
Get Break and Retest here: https://www.mql5.com/en/market/product/115398
Get Katana here: https://www.mql5.com/en/market/product/74631
Thank you for reading our manual guide and please don't hesitate to contact me if you have any questions!
Cheers,
Mo


