ETHUSD: Bullish Harami Pattern Above $1263
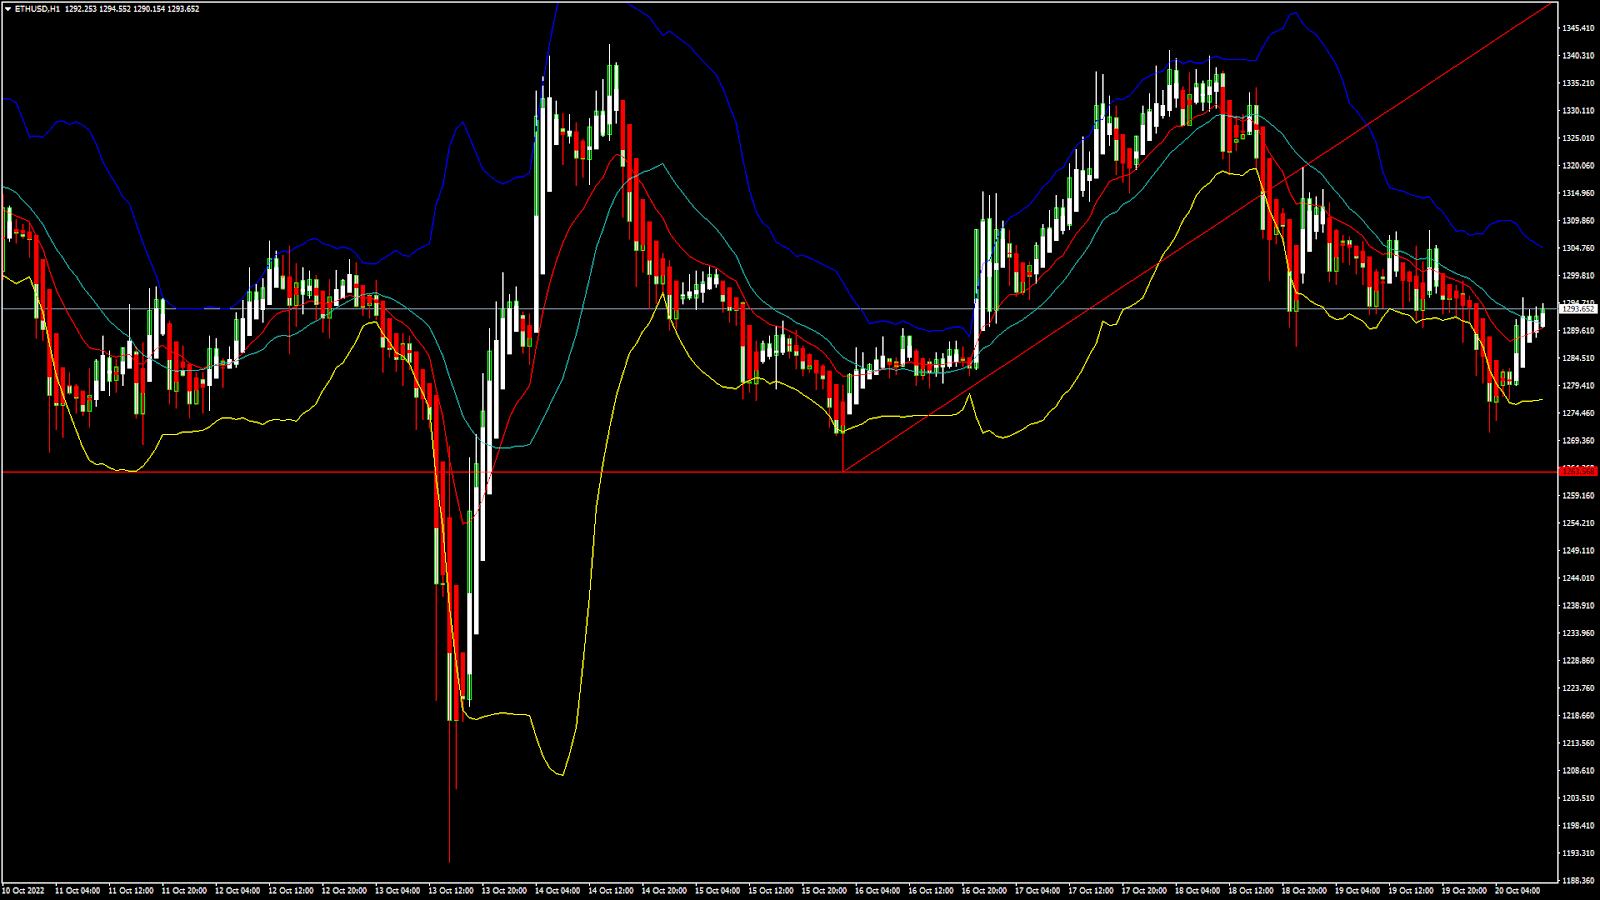
Ethereum was unable to sustain its bearish momentum and after touching a low of 1205 on 13th Oct, the price started to correct upwards against the US dollar. The price of Ethereum touched a high of 1342 on 14th Oct after which we can see a shift towards the consolidation phase in the markets.
We have seen a bullish opening of the markets which indicates the present bullish trend.
We can clearly see a bullish harami pattern above the $1263 handle which signifies the end of a bearish phase and the start of a bullish phase in the markets.
ETH is now trading just above its pivot level of 1291 and moving into a mildly bullish channel. The price of ETHUSD is now testing its classic resistance level of 1294 and Fibonacci resistance level of 1296 after which the path towards 1300 will get cleared.
The relative strength index is at 47 indicating a neutral demand for Ether and a shift towards consolidation phase in the markets.
We can see that the Williams percent range is back over -50 indicating the bullish tone present in the markets....More info: blog FXOpen