Market Prediction
Fractal Pattern Scanner is a market prediction indicator to predict turning point and cycle, which can provide both breakout and reversal trading opportunity. Fractal Pattern Scanner uses fractal geometry for market prediction. Fractal Pattern Scanner is the prediction Indicator that brings the latest trading technology after the extensive research and development with the fractal geometry in the financial market. The most important feature in Fractal Pattern Scanner is the ability to measure the turning point probability as well as the trend probabilty. Turning point and trend point is quantified in cycle anlaysis. Technically speaking, it is fractal cycle anlaysis. Your ability to measure the turning point probabilty and trend probabilty for each price action can boost your trading accuracy marginally. Before we go on to the trading strategy with this Fractal Indicator, let us cover what is the turning point probability and trend probability in detail.
Turning Point Probability and Trend Probability
In trading, the turning point probability can be viewed as the first attempt to quantify the price action in the probabilistic manner. In science, it is the pioneering concept towards modelling the stochastic cycle. Practically speaking, the method helps with market timing for our trading in the quantitative way. In any sort of cycle, when the object rises sufficiently high, it should hit the peak and it should fall towards trough. The turning point probability applies the same principle in Forex and Stock market data. Hence, the turning point probability answers the question “How close the price is to peak so the price will start to fall towards trough?” This is an important question to ask for the trader because this prediction often helps us to make money.
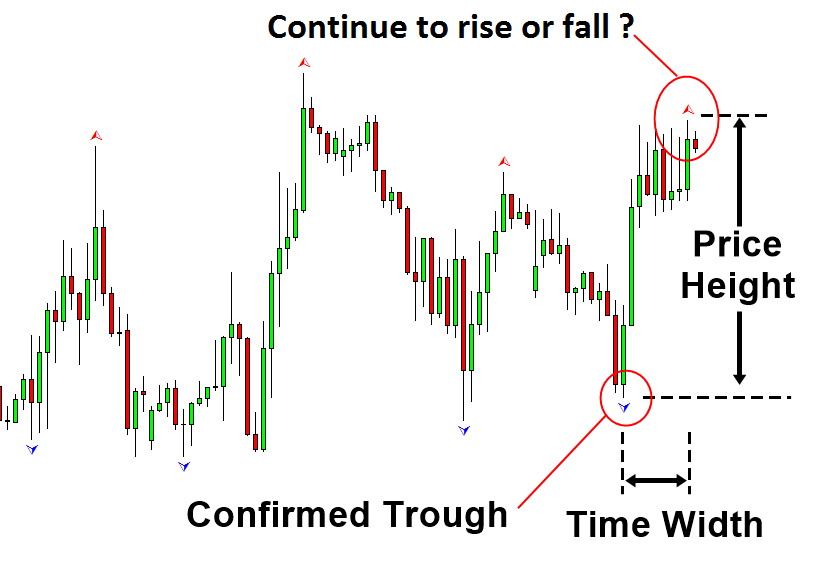
Figure 4-16: Measuring the price height and time width in swing high
We can not answer the question in the deterministic sense. However, we can answer the question in the probabilistic sense. Higher turning point probability means that the price is close to the peak. So we have a high chance to see that price makes a turn. For example, if the turning point probability is over 90%, there is a high chance that price can start to fall near the current price.
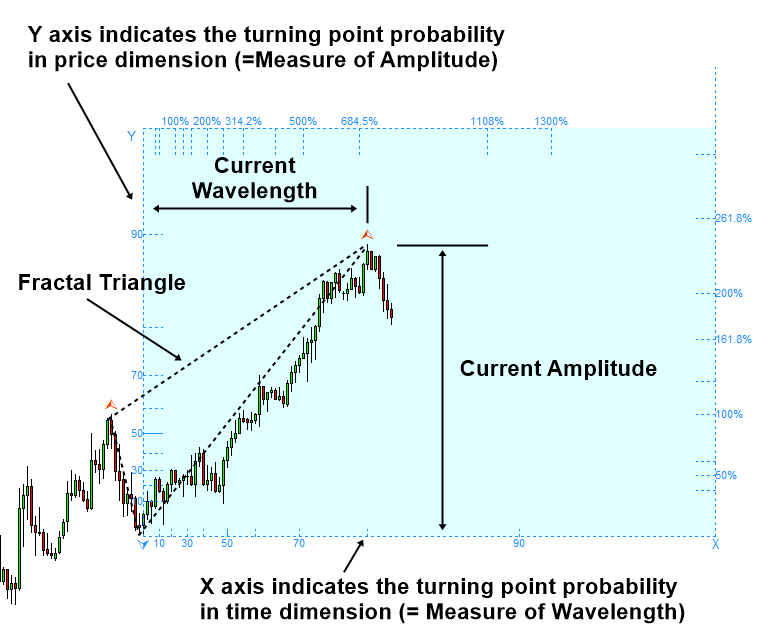
Figure 4-17: Fibonacci Probability Graph measuring probability for the peak (www.algotrading-investment.com)
On the other hands, lower turning point probability means that the price is still far from the peak. Hence, there is a high chance for the price to continue to rise. For example, if the price is near 30% turning point probability, then we can say that there is a high chance for the price to go up. Of course, this is true in the cyclic sense only as the price will repeat up and down endlessly. However, this quantified information is still useful for our trading. In fact, for the convenience, one can use the turning point probability to get the trend probability. Simply, you can subtract the turning point probability from 100% to get the trend probability.
Trend Probability = 100% - Turning Point Probability (i.e. Rule of Thumb only)
Hence, as a rule of thumb, 30% turning point probability is equivalent to 70% (=100% -30%) trend probability as there is high chance for the price to continue to rise in this case as it is far from the peak.
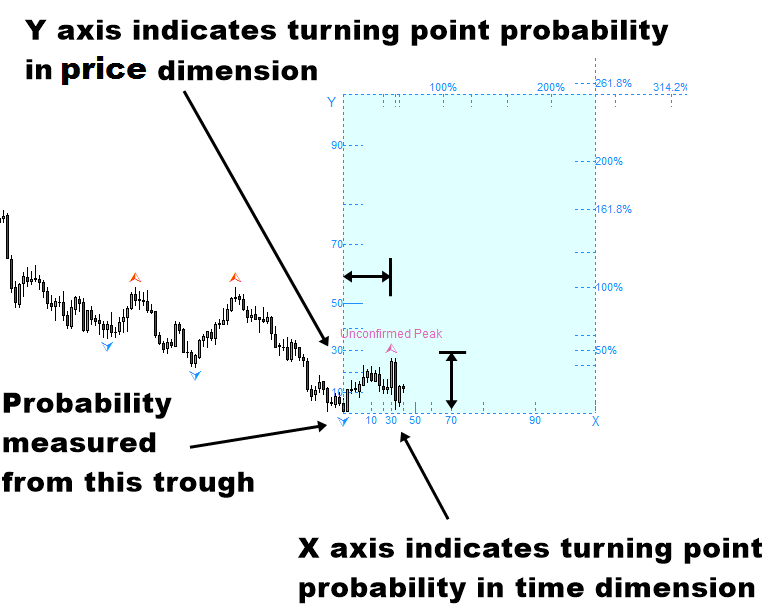
Figure 4-18: Turning point probability 30% example (= 70% trend probability) for peak
Support Resistance with Turning Point Probability and Trend Probability
The good thing is that the turning point probability goes well with most of technical analysis. In the book “Science Of Support, Resistance, Fibonacci Analysis, Harmonic Pattern, Elliott Wave and X3 Chart Pattern: In Forex and Stock Market Trading”, we have shown how to combine the turning point probability with support and resistance. When you combine the turning point probability with support and resistance, the turning point probability helps you to confirm the direction. For example, when the turning point probability is high at support, you can expect the price to turn and to rise at the support.
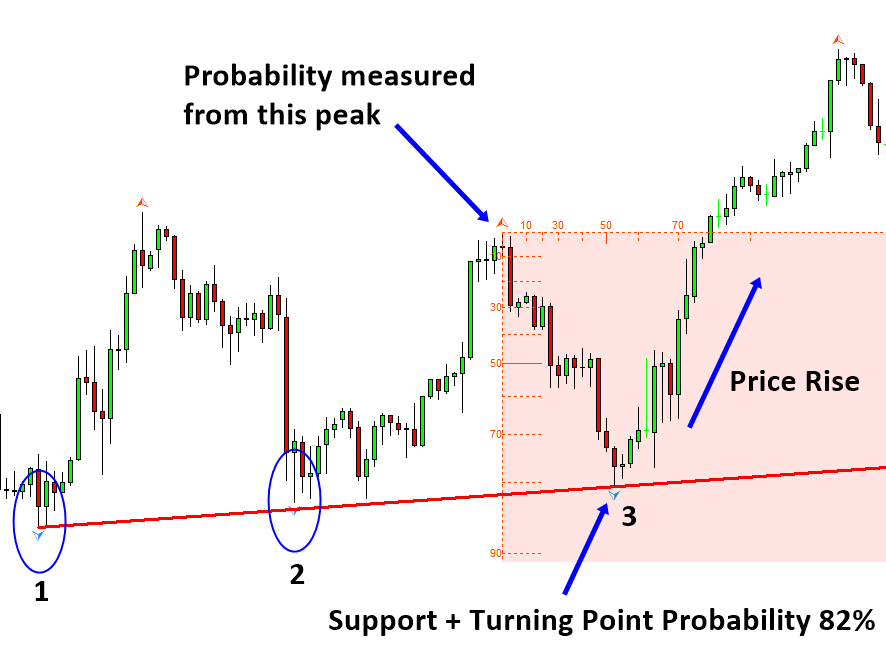
Figure 4-21: Turning point probably 82% at the support on S&P 500 Index H1 chart
Likewise, when the turning point probability is high at resistance, you can expect the price to turn and to fall at the resistance. You can use over 50% turning point probability to confirm the trading direction. However, typically, to predict the reversal movement, it is better to have the higher turning point probability. In this approach, the turning point probability complements the power of support and resistance to predict the trading direction. This is a good trading strategy to avoid or to reduce losing trades from the false breakout and false reversal when using the support and resistance. Likewise, in this book, we will show how to combine the turning point probability with supply and demand analysis to improve its performance. This would be the good demonstration toward using the probability for the practical trading.
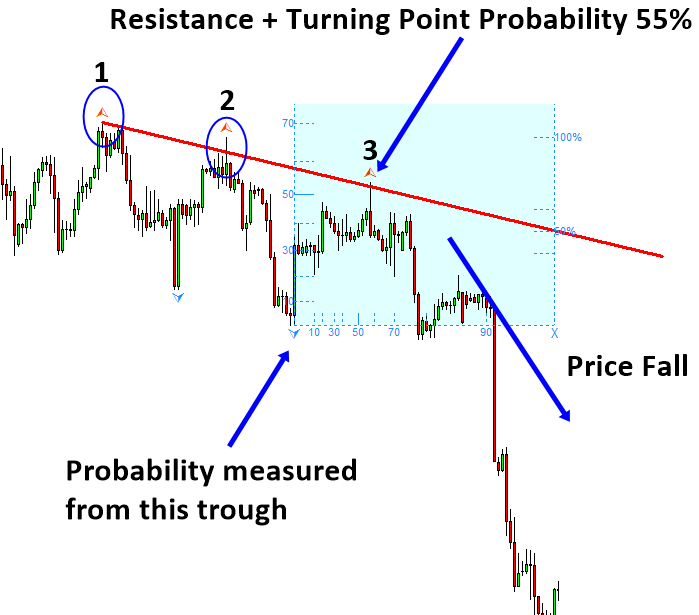
Figure 4-22: Turning point probably 55% at the resistance on EURUSD H4 chart
Supply Demand Analysis with Turning Point Probability and Trend Probability
The virgin supply and demand zone refers to the zone that are not touched by price after the pattern was identified for our trading. We can improve the accuracy of this virgin supply and demand zone with the turning point probability. For example, when we trade with demand zone, we can ensure that the turning point probability is high at the location of the buy price. High turning point probability indicates the high chance for the price to turn. In another words, it indicates the high chance that the price approaching to the demand zone can rise soon. In the example for S&P 500 index, the price in its first touch of the demand zone was located around 70% turning point probability. In addition to the higher timeframe check-up, this turning point probability ensures that price is near the trough before going up.
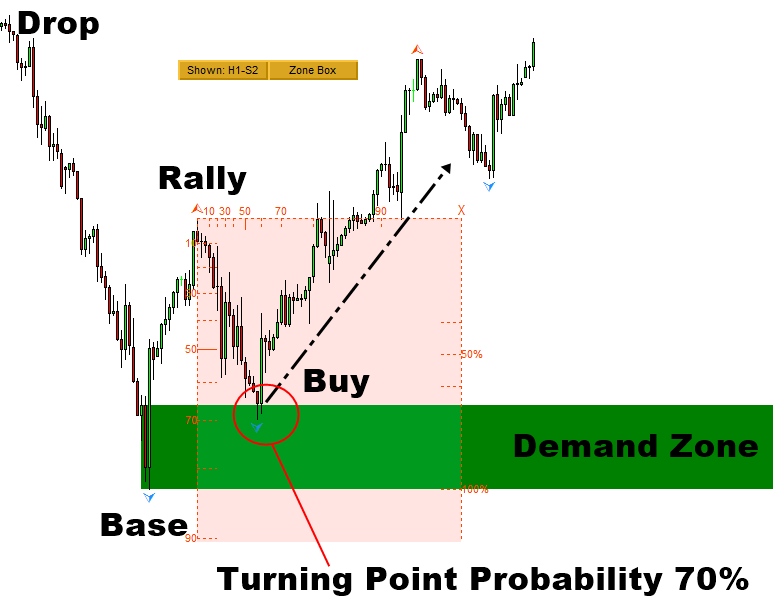
Figure 8-1: S&P 500 index H1 timeframe
Let us have a look at the supply zone trading example. In the example for Gold against US dollar, the price in its first touch of the demand zone was located around 50% turning point probability. Practically, it is recommended to confirm at least 50% turning point probability before making the buy or sell entry.
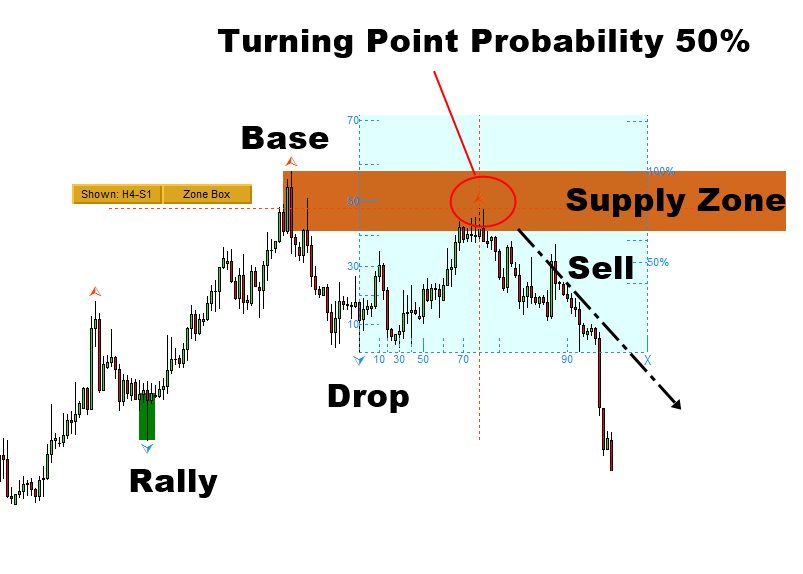
Figure 8-2: Gold against US Dollar (=XAUUSD) H4 timeframe (www.algotrading-investment.com)
Break Traidng and Reversal Trading with Fractal Pattern Scanner
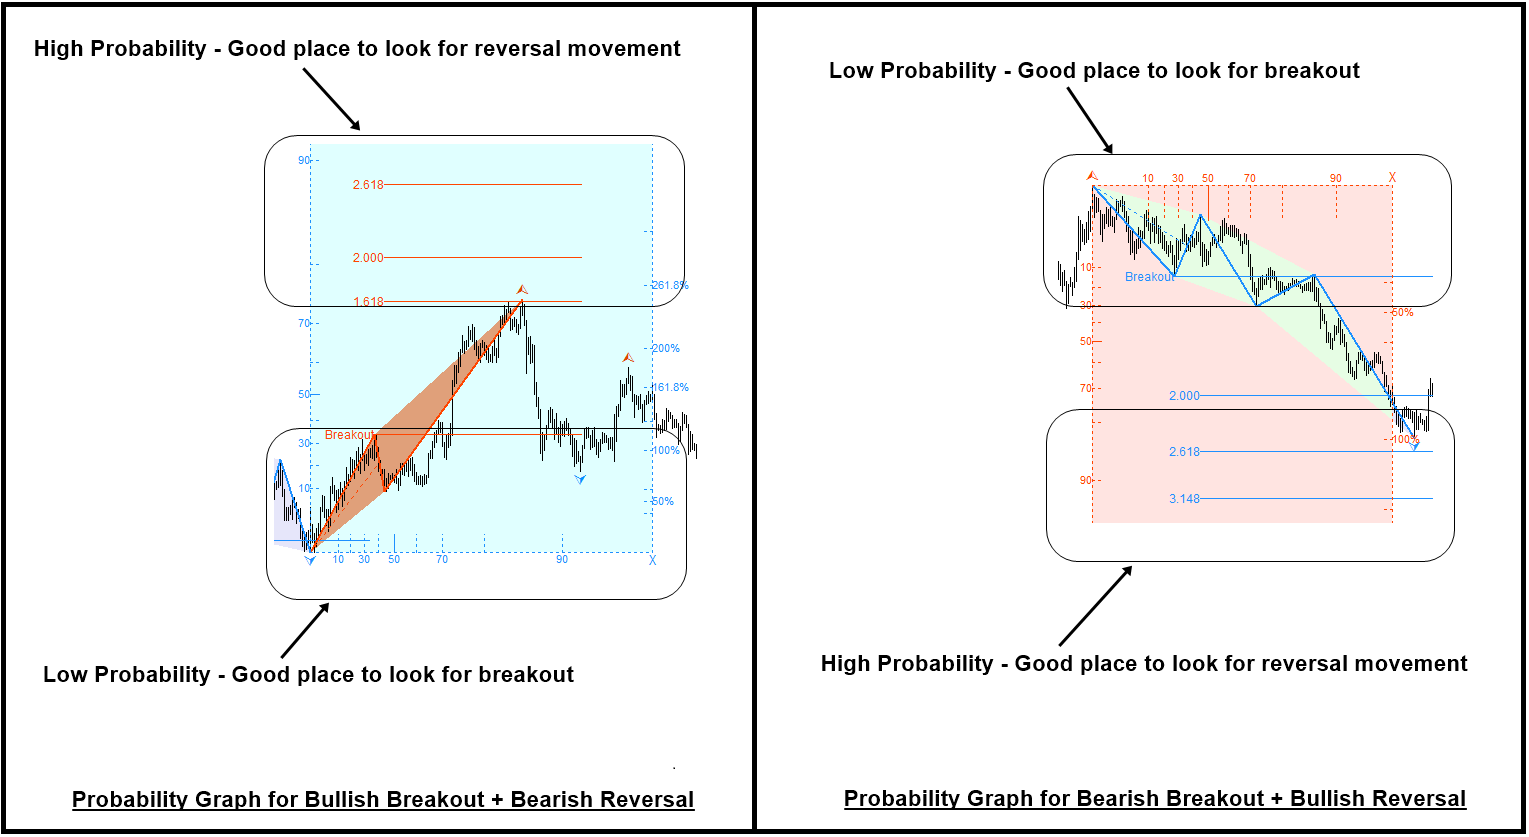
We have provided some trading ideas using Fractal Pattern Scanner with Support Resistance and Supply Demand Analysis. They were mainly for reversal trading examples. We chosen these examples because the support resistance and supply demand analysis are easy to use and they are popular. This does not mean that Fractal Pattern Scanner can be used with these two technical analysis only. In addition, this does not mean that Fractal Pattern Scanner can be used to detect the reversal trading opportunity alone. As long as you understand where to search breakout trading and reversal trading opportunity, you can combine the Fractal Pattern Scanner with any other technical analysis for reversal and breakout trading. Here is the screenshot showing the essential information about breakout and reversal trading opportunity. Especially, you can use any horizontal support and resistance with the turning point probability and trend probability. With little hands on experience, you will soon learn how to control your success rate and to do risk management with the turning point probability.
Fractal Indicator for MetaTrader 4
You can find the fractal indicator for MetaTrader 4 from this link: https://www.mql5.com/en/market/product/49170
- You can use Fractal Pattern Scanner with other support and resistance or supply demand analysis ( Mean Reversion Supply Demand or Ace Supply Demand Zone )
- You can also use Fractal Pattern Scanner with Triangle Pattern, Rising Wedge and Falling Wedge Patterns ( Price Breakout Pattern Scanner or Advanced Price Pattern Scanner )
- You can also use Fractal Pattern Scanner Elliott Wave Pattern ( Elliott Wave Trend or X3 Chart Pattern Scanner)
- You can also use Fractal Pattern Scanner with Harmonic Pattern Detection Indicator ( Harmonic Pattern Plus or Harmonic Pattern Scenario planner )
- Trade with Pairs Trading and Spead Analysis ( Pairs Trading Station )
When you use the turning point probability with Harmonic Pattern or Elliott Wave Pattern, try to use the zones at the pattern completion interval to gauge the reletive strength of breakout and reversal at the zone.
Fractal Indicator for MetaTrader 5
You can find the fractal indicator for MetaTrader 5 from this link: https://www.mql5.com/en/market/product/49169
- You can use Fractal Pattern Scanner with other support and resistance or supply demand analysis ( Mean Reversion Supply Demand or Ace Supply Demand Zone )
- You can also use Fractal Pattern Scanner with Triangle Pattern, Rising Wedge and Falling Wedge Patterns ( Price Breakout Pattern Scanner or Advanced Price Pattern Scanner )
- You can also use Fractal Pattern Scanner Elliott Wave Pattern ( Elliott Wave Trend )
- You can also use Fractal Pattern Scanner with Harmonic Pattern Detection Indicator ( Harmonic Pattern Plus or Harmonic Pattern Scenario planner )
- Trade with Pairs Trading and Spead Analysis ( Pairs Trading Station )
When you use the turning point probability with Harmonic Pattern or Elliott Wave Pattern, try to use the zones at the pattern completion interval to gauge the reletive strength of breakout and reversal at the zone.
Trading Strategy Books
Of course, the article has limited space to write whereas the book can provide more space and more organized ways to learn trading. Hence, we provide the two books which provide you the trading strategy in detail. If you want to become a successful trader, then we recommend reading these two books.
Predicting Forex and Stock Market with Fractal Pattern
Technical Analysis in Forex and Stock Market
If you want to access the free forex trading education, then you can also visit our website here.
https://algotrading-investment.com/2019/07/23/trading-education/
Summary on Fractal Indicator
Use Turning point probabilty and trend probability in this Fractal Indicator with any type of horizontal support and resistance to find braekout trading or reversal trading opportunity.
Link 1: [ Fractal Pattern Scanner for MetaTrader 4 ]
Link 2: [ Fractal Pattern Scanner for MetaTrader 5 ]
YouTube Videos
1. Breakout Pattern and Breakout Trading Signal Explained: https://youtu.be/4XGuMIMaV6w
2. Turn Support & Resistance to Killer Strategy with Fractal Pattern Scanner:: https://youtu.be/UbORmOacKIQ
3. Trading with Fractal Wave and Stochastic Cycle using Fractal Pattern Scanner: https://youtu.be/_bstJrIevSQ
4. Gann Angles, Mother Wave pattern,Fibonacci Expansion,Andrew's Pitchfork, and Probability Panels (Optional Information only): https://youtu.be/QGHvKjECX1U
Fractal Pattern Manuals
● Turning Point Prediction After Two Years Usage (Must Read)
● Fractal Pattern Scanner Trading Operation Tips (Must read)
● Breakout Trading or Reversal Trading (Must read)
● Understanding Gann’s Angles with Probability – Brand New Technology
● Combining Gann Angles from Multiple Projection Origins
Fractal Pattern Strategy Guides
● Geometric Prediction, the Bible for Successful Trading (Must Read)
● Turning Point, Peak, Trough, Swing High, Swing Low, and ZigZag
● Fractal Wave, Mother Wave, and Child Wave
Trading Price Pattern with Turning Point Probability
● Mother Wave and Child Wave with Joint Probability
● Predicting Volatility with Turning Point Probability
● Support and Resistance Trading with Turning Point Probability
● Harmonic Pattern Trading with Turning Point Probability
● Falling Wedge Pattern and Rising Wedge Pattern with Turning Point Probability
● Gann Angles with Probability
● Reversal Trading with Fractal Wave and Stochastic Cycle (Must Read)
● Breakout Trading with Fractal Wave and Stochastic Cycles (Must Read)
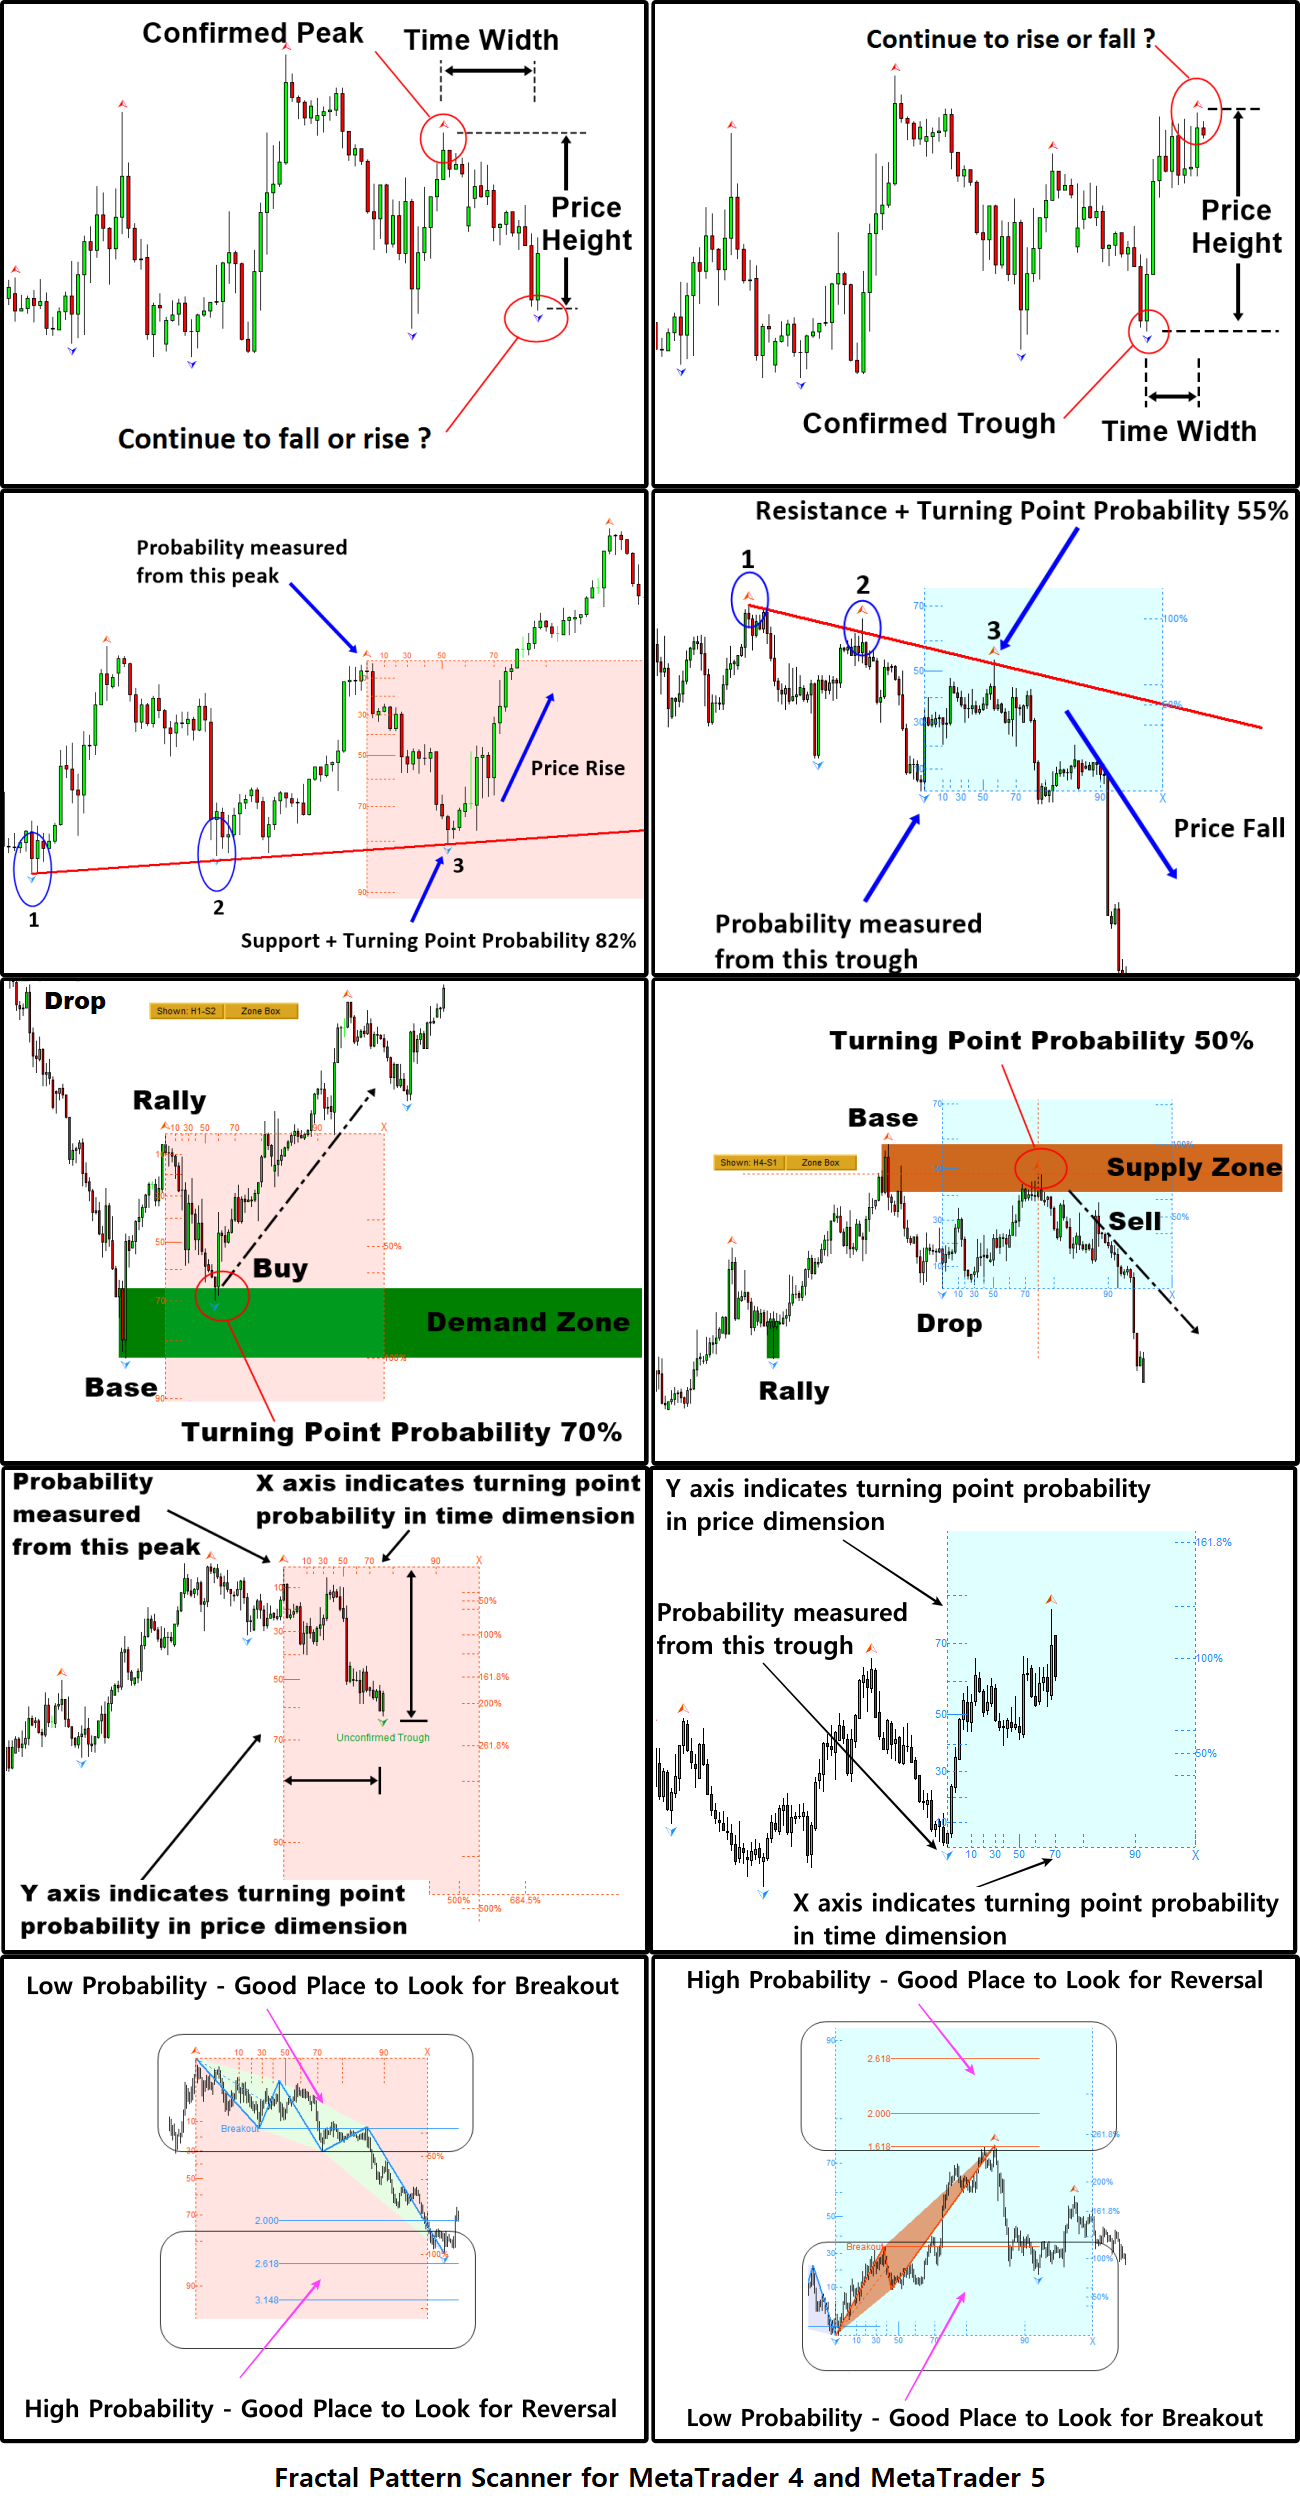
You can also have a look at the compiled screenshot below to understand how to use the market prediction for your trading. To understand the screenshot better, think that any buy signal is mirrored horizontally to sell signal in single trading strategy. Hence, the turning point signal at peak is mirrored horizontally to the turning point signal at trough. Left side explains the turning point at trough and right side explains the turning point at peak. Once you understand this screenshot, you should be able to master the market prediction with a bit of knowedge in support resistance or similar strategy.