In this chapter I would like a little broke down for a very fruitful
topic of trader Elliot waves which can be applied to longposition trade.
This style of trading can be called as swing trading, and certainly it
is not included among to the most difficults, but certainly it is
necessary to explain the basic principles of operation of this theory
and also to make here some basic research and study.
Elliot held the theory that the market moves in certain cycles - waves in the style of the Fibonacci sequence (1,2,3,5,8,13,21) and by which it can move to some specific direction.
Generally the Elliot waves represent :
-every action causes a reaction.
-5 waves itself are moving in the direction of the current trend.
- 3 waves after that can represent two scenarios ,...the continuation of the main trend or reversal signal
The structure and principle of operation of the cycle:
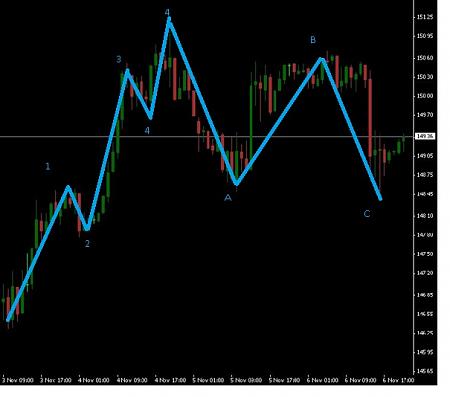
The actual cycle is a system of five waves, each wave has a specific characteristic:
Wave 1: Determination of the first wave is always the most difficult because it does not live up to be such clear and immediately I explain why. I give you an example: we expect the bulls trend and we expect the emergence of the first logical wave , but everything : fundamental analyzis , any other reports are very negative so these fact talk against us . This is why it is necessary to wait for a small correction wave # 2, which should be created
Wave 2: is right afrer No. 1 and this wave it is the already mentioned correction of the wave N.1 and it would not exceed. For the reports so they are still negative, low prices and tested main hence we refer to max. Fibonacci 61.8% return, bearish sentiment is clear and deeply established. Despite all this has been seen already some positive signs, such as. volume should be much smaller than the wave No. 1.
Wave 3: the third wave is usually the largest and most powerful (some "experts" state that the fifth wave is the greatest, it is more linked to the commodity market). With regard to fundamental analysis so you can expect to have much more positive messages and the general bearish sentiment is fading.
Wave 4: what we should mention about No. 4 waves is purely a correction leads to the return rates of 38.2% Fibonacci level of return (not very often happens that the return is greater). The volume is significantly lower / smaller than the waves at No. 3 (point where it is good to enter some trade).
Wave 5: considered to be the last wave of the dominant trend. The reports are clear and positive sentiment is also inclined to the side of a bull. The volume is smaller than the wave No. 3 and many of the starting torque indicators "indicate" the divergence which may be a sign of our TP-target point (prices reach new high).
The same principle but vise versa is the same in oposite scenario.
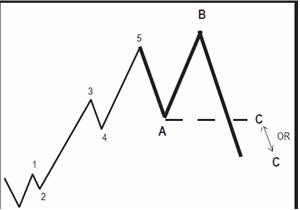
After these five there are three corrective waves, which also have some specifics:
Wave A: These corrections are much more difficult to identify. In this wave we still register the good news and many investors believe in the fact that it is only a "minor correction and it will move on the bull . Many of the indicators that accompany wave show a greater volume, increasing volatility.
Wave B: there is a small price back up. At this point we register the formation of the "shoulder, head, arm." The actual volume of wave B should be less than Wave A. Sentiment and the messages results (positive or negative) should be the same i.e., 50:50 but the bear is still not admitted.
Wave C: here it is clear , significant volume declines and investors are realizing that it the end of the formation.
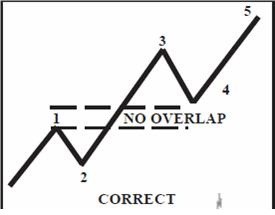
This principle is also identical with oposite scenario.Facts that must be clearedRule 1: says that the wave N.3 is always the longest what means that , longer than wave 1 and 2. Certainly we should not look shorter than the first wave and second wave together, but on the other hand, we accept the same as the length of the two waves.
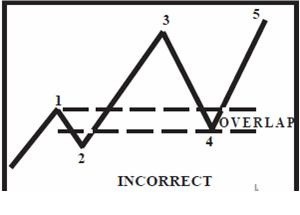
Rule 2: says that no wave should not exceed .4 wave, should not overrun wave 1. in no way we do not accept for "cash" markets, where futures accept 10 to 15% overlap of wave No. 1
Elliot corrections alias section A, B, C wavesThis way, we should start every time. But, we must ask question: "Where is the right entry point into the business? "For beginners, it will certainly be the point between the wave 1 and 2 . Certainly you will say, "But I lose the nice movement in wave 1? "Yes it is, but for this I have only one answer. PATIENCE !!!!! For pro traders the best entry point will be definitely the wave 1. !!!Many traders use the Elliot theory makes money mainly for waves 1 to 5, and what I personally consider as a mistake on stretch of waves A, B, C ignore. We distinguish two types of corrections:
simple correction
composite correction
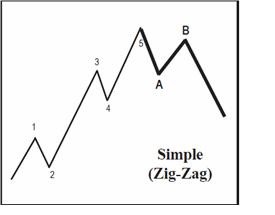
A simple correction
It contains, respectively, or a simple formation of Zig-Zag. It consists of 3 waves where wave B is little pullback (mostly its length is about 75% of wave A). Wave C then proceed down to the level of wave A. Its length (wave C) can be calculated in this way :
1 . it could be as long as wave A
2 . 1.62 x the lenght of wave A
3. 2.62 x the length of wave A
But please realize that this type of correction is very rare and mostly we cant find it in very clear way
Composite correction
it can be a flat, triangular and irregular
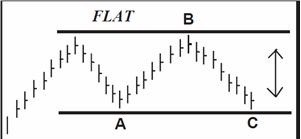
1.Flat corrections:
With flat correction is the length of each wave identical. The fifth wave of market slips into wave after wave A and wave B to A, whose length is equal to the length of the waves A and create a level as high wave N.5. Then follows the wave C, which again falls to the level of wave A.
2.Triangular corrections:
This type of correction occurs during waves 1-5. Specifically, the triangular correction occurs during the 3 waves. What is necessary to explain the difference between "normal" triangular formation and Elliot triangle in the third wave. Elliot triangle is the system of 5 smaller waves, which are designated by letters a, b, c, d, e, consecutively. It is very common and also are very common in the corrective wave B. This type of formation can really confuse a trader and must be carefully studied.
3.Irregular corrections
In this type of correction corrective wave B, unusually makes a new high. Wave C may drop to the level of wave A, or even lower.
Applies to:
wave B = 1.15 x length of the wave A
1.25 x length of the wave A
wave C = wave length of 1.62 x A
2.62 x wave lenght A
What we should have taken is that :
when the wave 2 appears simple correction, we can expect a wave 4 correction composed.
when the wave 2 correction appears composed, we can expect a wave 4 correction easy.
Effective use of Elliot's theorySo after a schock therapy ( elliot waves ) lets have a look on practice.
The basics of Elliot's theories are clearly defined, but as they say: "Different is the theory and different is the practice! "Nowadays there are countless different indicators and platforms that are able to apply the principle of Elliot's wave.
The first thing we should recognize is the complexity of your system,. Of course Im not saying that is necessary to use only one strategy, and so it can be combined with one or two strategies.
Step Number 1
It is essential to have appropriate display style chart.
According to the basic patterns we suggest these waves
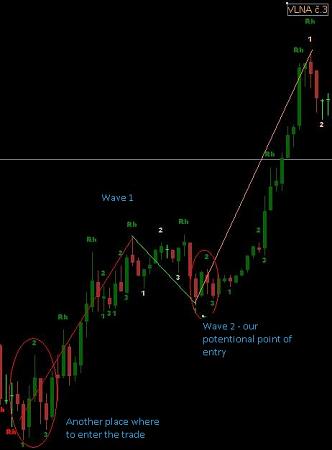
And now i will show you how .The usage of Elliot's theory with the combination of other systems !!!
In the case that we will add a MACD indicator it will ONLY HELP us to detect hidden divergence but as we can see the signal si totaly clear !As i have been writing in mostly in my all posts " YOUR SYSTEM MUST DEVELOP!"
There is nowhere written that you must strictly use the only one system for trading ,...lets combine them !!! BUt there is one condition ! YOU MUST UNDERSTAND to those systems .
If you have successfully practiced using simple implementation of waves now we will show how to effectively combine multiple skills in our favor. We will use the 1-2-3 high and low system. In this case we can use them to refine our entry point and the fact that the luxury of a smaller timeframe. (ex, 30min.). Once we look and our situation has changed. The picture shows the place where it is appropriate to enter into trade and therefore do not lose the nice move in the 1.wave .Although there is a specific risk in wave 1 and we should very carefully filtered potential signals (each candle formations). For further refinement we can use a specific indicator (alert us to against divergence) that can only confirm us the proper signal.
At the case of exiting the trade there are two ways how to do it :
1. By manual calculation of the size of wave 5 and by just setting the TP.
2. Or by using a system based again on signals .In our case we will do it in this way :
- we will change from larger TF to lower TF
- we will check the candle formations + the 1-2-3 high/low system must give us the exit point.
- we will also have a look on our MACD indicator for exit point.
As we could see on this example we can in effective way combine the systems but dont forget ! YOU MUST UNDERSTAND them . This sort of trading is definitely for long time trading and as i said at the beginning it is for mainly more experienced traders.
Wish you many green pips !
T