EURUSD NICE 60pips -TRADING WITH WEIS WAVE WITH SPEED INDEX
9 April 2020, 15:48

0
137
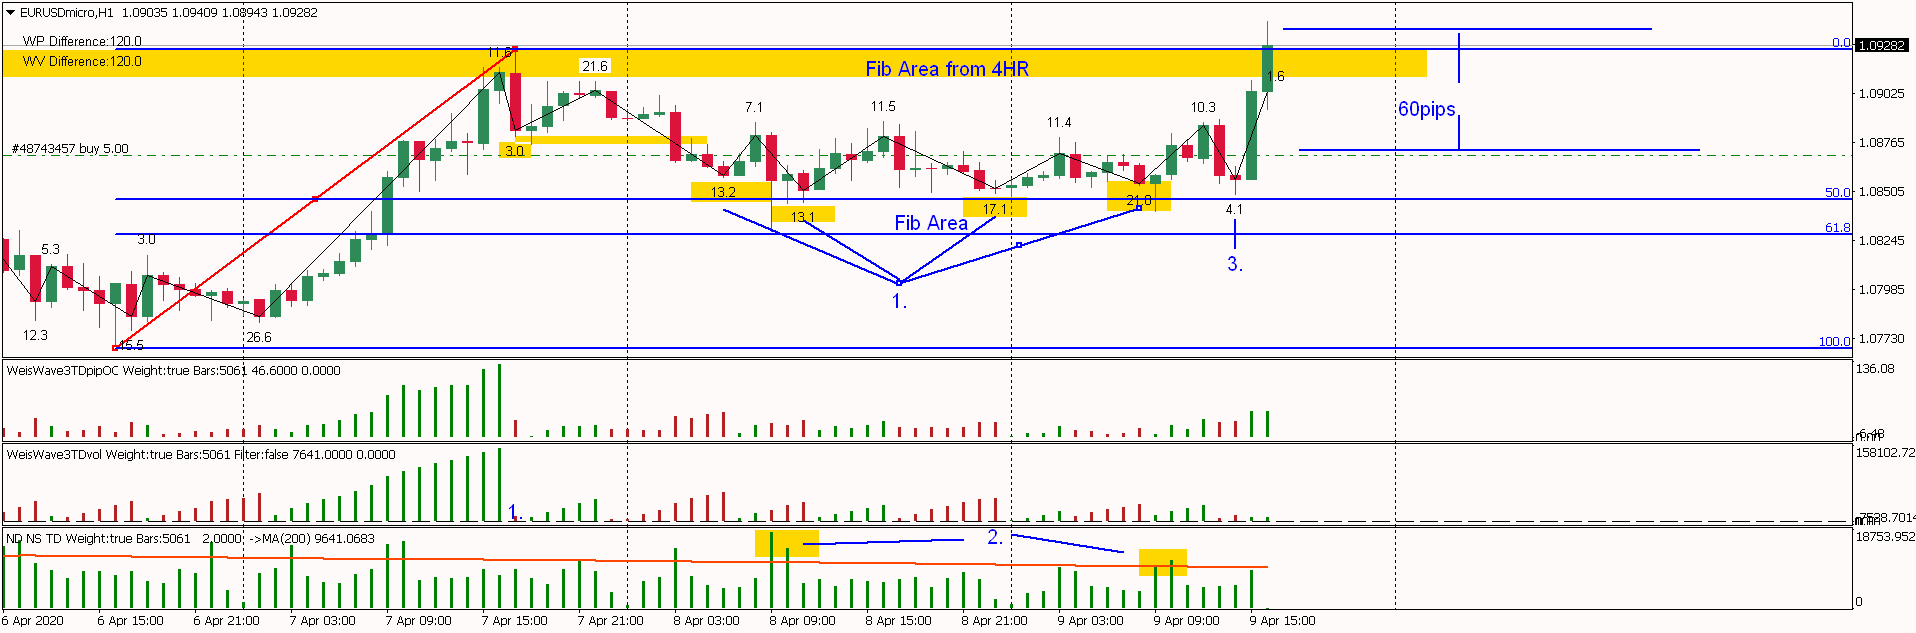
Setup 1Hour Chart Indicators: Weis Pip Wave, Weis Wave with Alert (+Speed Index) and No Demand No Supply ( https://www.mql5.com/en/users/takisd/seller)
Our Story:
We have hit 50-61Fib several times (ranging) and smart money is accumulating everytime we go down- that is smart money posistioning. How is this visible:
- Look at the Speed Index at the down waves higher than the Speed Index of the up Waves (down waves SI:13.2, 13.1, 17.1 and 21). If you notice as time passes by Speed Index is increasing from 13 to 21 which means it's getting ready to explode.
- Look at volume bars at the bottom - high volumes at the bottom
- Fast fake down wave with a Low SI of 4.1
... ready for take off , 60 pips. (one order still running is visible on chart)
We have broken 4HR Fib Resistance let's see if it will continue up.
This is the Magic of Speed Index. Enjoy!