
Trading on world stock exchanges today is sluggish. Market participants took a wait-and-see position before the Fed decision on rates. Investors almost did not react to the speech of President Donald Trump at the UN in which he threatened to "completely destroy" North Korea if the US had to defend itself or its allies. It seems that investors do not believe in such a scenario of development of the geopolitical confrontation on the Korean peninsula.
Today, the focus of market participants is the Fed meeting. The US Central Bank is expected to announce a reduction in the balance of 4.5 trillion dollars. However, the rates will remain at the current level in the range of 1.00-1.25%.
The change in the Fed's forecasts regarding the dynamics of interest rates for the next year is the most interesting issue for investors. If the prospects for raising rates worsen, the dollar may be under pressure. At the same time, the US stock markets will receive an additional impetus to the continuation of the bullish trend.
Another point that deserves attention in assessing the prospects and dynamics of stock indices. Republicans in the US Senate prepared a preliminary draft agreement on the budget, which laid down the parameters of the tax reform. Until now, stock markets have ignored the failures of the administration of the US president, relying mainly on the strong reports of US companies and macro statistics.
Adoption of the budget is a prerequisite for passage in the Senate of the law on taxes by a simple majority vote, without the support of representatives of a democratic party.
In case of successful outcome of voting on this issue, the US stock market will respond with growth, as the tax reform of the administration of Donald Trump is designed to reduce taxes for US companies.
In general, the positive dynamics of the US stock market remains.
*)An advanced fundamental analysis is available on the Tifia Forex Broker website at tifia.com/analytics
Support and resistance levels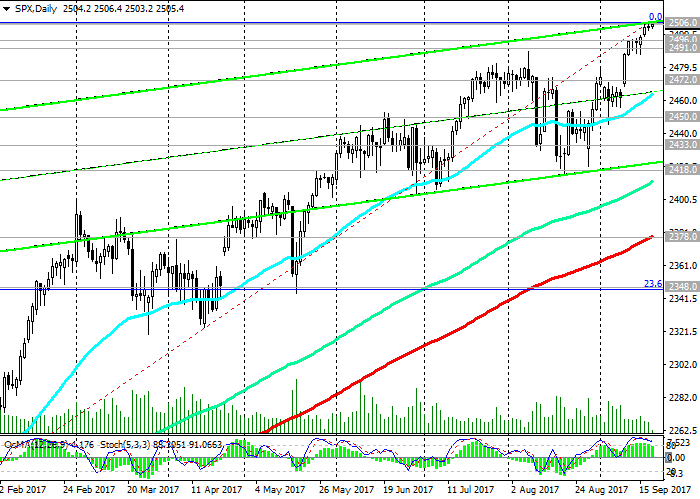
After Monday's index S & P500 updated the annual high near the mark of 2506.0, today the index of the second day is trading in a narrow range near this level.
The OsMA and Stochastic indicators on the daily, weekly, monthly charts are still on the buyers’ side.
Short-term downward correction is possible to support levels 2496.0 (EMA144), 2491.0 (EMA200 on the 1-hour chart). Deeper correction is allowed to the support level 2472.0 (EMA200 and the bottom line of the uplink on the 4-hour chart).
The upward trend in the S & P500 index is maintained as long as it trades above the key support level of 2378.0 (EMA200 on the daily chart).
Only the breakdown of the support level of 2348.0 (the Fibonacci level of 23.6% of the correction for growth since February 2016) could significantly increase the risk of the S & P500 returning to a downtrend.
About the reversal of the bullish trend is not yet talking. There is a possibility of further growth.
Support levels: 2496.0, 2491.0, 2472.0, 2463.0, 2450.0, 2433.0, 2418.0, 2378.0, 2348.0
Resistance levels: 2506.0

Trading Scenarios
Sell Stop 2502.0. Stop-Loss 2507.0. Objectives 2496.0, 2491.0, 2472.0, 2463.0, 2450.0, 2433.0, 2418.0, 2378.0
Buy Stop 2507.0 Stop-Loss 2502.0. Objectives 2525.0, 2550.0
*) For up-to-date and detailed analytics and news on the forex market visit Tifia Forex Broker website tifia.com


