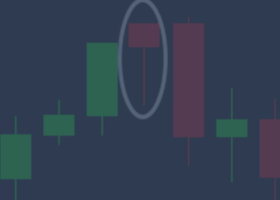
Doji is an important candlestick pattern.
Doji is formed when the open price and the close price are almost equal for a candlestick.
It forms frequently on the lower timeframes and is less reliable.
However when it forms on a higher timeframe like Daily and Weekly, it is a strong signal.
When you spot the doji pattern, think of a imminent breakout in the market.
This is precisely what happened on USD/JPY Daily chart when I spotted a doji pattern.
Read this blog post in which I explain in detail a USD/JPY doji pattern trade that made 1200 pips.
Always make sure you take care of the risk and don't over anticipate the pattern.
Markets are always unpredictable.
When you keep the risk low, you don't lose much if the market gives you a surprise in the wrong direction.


