

Trading recommendations
Sell Stop 2198.0. Stop-Loss 2205.0. Objectives 2192.0, 2173.0, 2165.0, 2155.0, 2145.0, 2130.0, 2115.0
Buy Stop 2205.0. Stop-Loss 2198.0. Objectives 2210.0, 2250.0
Technical analysis
With the opening today, the S&P500 is in a narrow range, as well as other major US stock indexes. Investors apparently do not want to remain in the open position before a day off tomorrow, and reduced in the US on Friday. The vast number of positions - long and close them, even partial, may cause a decrease in the indices. It is also still not clear how the new policy will affect Trump in the US economy.
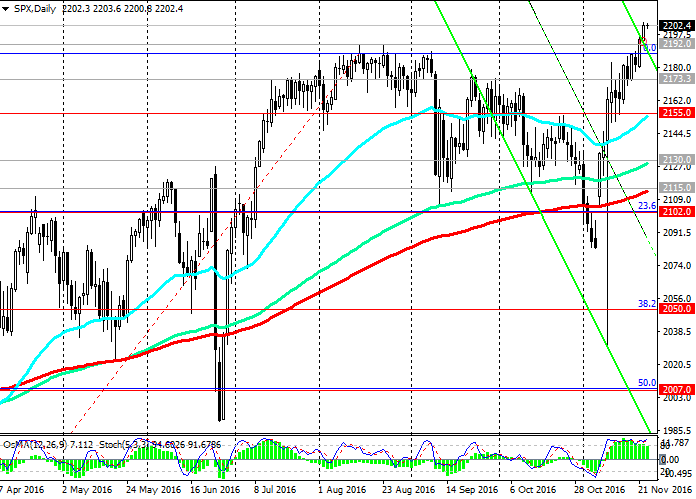
The S & P500 during the last 3 weeks of almost non-stop growth completely blocked the fall of more than 2 months, the penultimate and rose above the recent yearly highs recorded in August near the mark 2192.0. Near this mark - the upper limit of the descending channel on the daily and weekly charts. Yesterday, a new local maximum near the mark of 2203.0 was recorded.
Indicators OsMA and Stochastic on the daily, weekly, monthly schedules are on the side of buyers.
The price has broken the upper line of the descending channel on the daily and weekly charts near the mark 2192.0. It is likely that the index will continue to grow in the next week. The positive dynamics of the US stock market is maintained.
However, do not exclude short-term correction to the levels of support 2192.0, 2173.0, 2165.0 (the high of October), 2155.0 (EMA200 on 4-hour chart, EMA50 daily chart). Break 2155.0 support level could trigger deeper correction to levels of 2130.0 (EMA144 on the daily chart), 2115.0 (EMA200).
Breakdown level of 2102.0 (23.6% Fibonacci level of the correction to the growth since February 2016 and the level of 1828.0) could trigger a further decline to the support level of 2050.0 (38.2% Fibonacci level, EMA200 on the weekly chart) under the newly formed downtrend channel on the daily graphics and jeopardize the upward trend of S & P500. Break of the support level of 2007.0 (50.0% Fibonacci level) can already speak about the end of the bullish trend. However, while the S & P500 index is above the levels of support 2115.0 (EMA200 on the daily chart), 2102.0 (23.6% Fibonacci level of the correction to the growth since February 2016 and the level of 1828.0), the positive dynamics of the index maintained.
Support levels: 2192.0, 2173.0, 2165.0, 2155.0, 2145.0, 2130.0, 2115.0, 2102.0, 2070.0, 2050.0
Resistance levels: 2205.0, 2210.0, 2250.0
Overview and Dynamics
Today, before the day off and abbreviation in the United States on Friday in connection with the Day of Thanksgiving, investors are likely to continue to take profits, resulting in the rapid growth of the dollar and the stock market, despite the fact that the overall positive dynamics of the dollar and the US stock market at this will continue.
After the election of Donald Trump the new president of the United States US stocks and the dollar have demonstrated impressive growth.
In the Asian session and early European environment in the US dollar declines. The WSJ dollar index, which reflects the value of the US dollar against a basket of 16 currencies, fell 0.1% to 91.27. Prior to the current decline WSJ index grew for 10 consecutive sessions, it was the longest period of growth since May 2012. It is expected that the Fed will raise interest rates at the December meeting, and the decision to support the US dollar, increasing its profitability. Judging by the futures market, investors expect a rate hike in December, with a probability of 94%.
More than two weeks ago, the DJIA was below 18,000 points. But after the presidential election rally began in the United States.
Today, the DJIA is near the mark 19040, S & P500 - close to 2203 points, while the Nasdaq Composite rose to 5385. This new record levels for all three indexes.
From November 9 to yesterday DJIA index rose by 3.4% and the S & P500 - 2.7%. Now the DJIA could end the year with growth of 9.2% and the S & P500 - 7.8%. Lifting shares led the financial and industrial sectors of the US economy.
The US economy is on the rise, spending on infrastructure in the next year should increase, as suggested by the economic policy of Trump, which is favorable for the short term, interest rates in the US are likely to be raised in December, and probably in the next year that will further stimulate growth, primarily shares of banks and the financial sector.
Today, investors will be focused on Fed's FOMC minutes of the meeting, which is published in the 18:00 (GMT). There is a growth of volatility expected in the financial markets, and on Thursday in the US holiday.

Author signals - https://www.mql5.com/en/signals/author/edayprofit
*)presented material expresses the personal views of the author and is not a direct guide to conduct trading operations.


