Technical Analysis of CAD/CHF for March 28, 2016
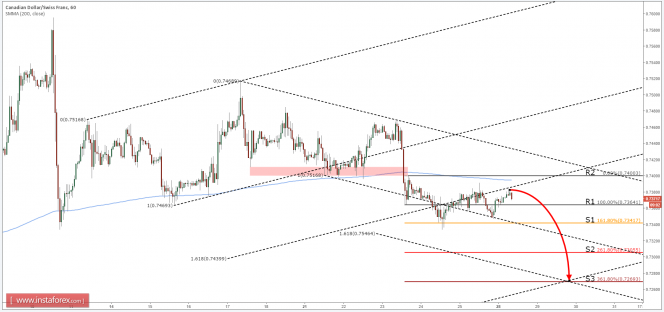
CAD/CHF broke below the 200 Moving average and it is currently trading lower suggesting that the trend is down.
Applying two Fibonacci channels, it is obvious that price broke below the 161.8% trendline of the ascending channel and lower trendline of the descending channel. Fibs, applied to the first corrective wave after the support (0.7400) breakout, suggests that the final target could be near 0.7270, where it crossing with the retracement levels of both Fib channels.
Consider selling CAD/CHF at the current level (0.7370), targeting either S2 (0.7300) or S3 (0.7270) as a final target. Stop loss should be just above R2 (0.7400)
Support: 0.7340, 0.7300, 0.7270
Resistance: 0.7365, 0.7400

The material has been provided by InstaForex Company - www.instaforex.com


