01 Maret 2016 2:34 PM
General overview for 01/03/2016:
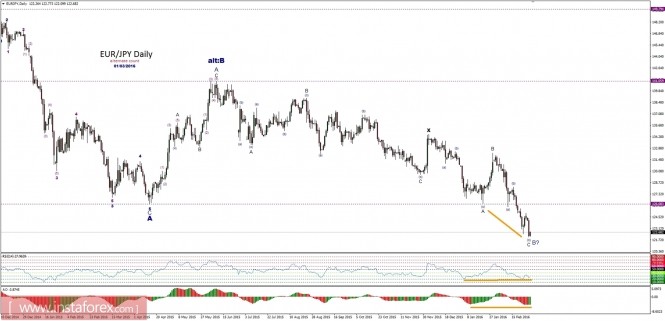
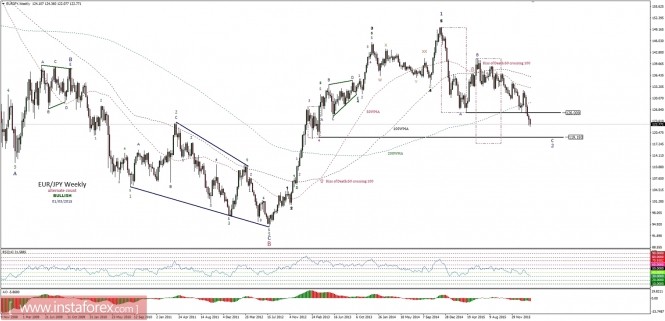
Let's take a look at the higher time frame technical picture and Elliott wave count for this pair. In a daily time frame, we can see a complex corrective structure labeled as ABC-X-ABC pattern. The sub-wave B blue of this structure might be in place and the reason for this is a growing bullish divergence between the price and momentum oscillator and RSI. In the result of this divergence, the sharp bullish reversal in form of wave C blue should occur any time soon according to the main count. On the other hand, the alternative count indicates the top for the wave B blue has been made already and the current downside drop is the wave C blue of the wave 2 corrective cycle. In that case, the current big corrective cycle in a weekly time frame might be soon completed and this pair might start to develop wave 3 blue to the upside.
Support/Resistance:
119.43 - WS3
120.96 - WS2
122.45 - Intraday Support
122.56 - WS1
124.05 - Weekly Pivot
125.01 - Intraday Resistance
125.68 - WR1
127.18 - WR2
Trading recommendations:
Day traders should refrain from trading and wait for a better trading setup to occur in the near term. We will open buy orders when the bottom of the wave B blue is in place, so buy stop orders should be placed at the level of 125.03.


The material has been provided by InstaForex Company - www.instaforex.com


