
USD/CAD Pivot Points Analysis - ascending triangle pattern with R3 Pivot level to be broken
24 September 2015, 15:11

0
1 017
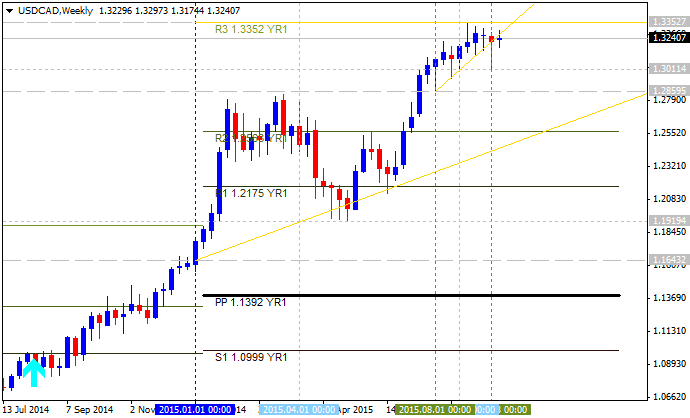
W1 price is located far above yearly Central Pivot at 1.1392:
- the price is on bullish market condition for ranging between R2 Pivot level at 1.2568 and R3 Pivot level at 1.3352;
- price is trying to cross R3 Pivot level at 1.3352 from below to above for good possible bullish breakout;
- ascending triangle pattern was formed by the price to be broken from
below to above for the bullish trend to be continuing;
- if weekly price will break R3 Pivot level at 1.3352 on close weekly bar so the primary bullish market condition will be continuing, otherwise the price will be ranging within the levels.
| Instrument | S1 Pivot | Yearly PP | R1 Pivot | R2 Pivot | R3 Pivot |
|---|---|---|---|---|---|
| USD/CAD | 1.0999 |
1.1392 |
1.2175 | 1.2568 | 1.3352 |

Trend:


