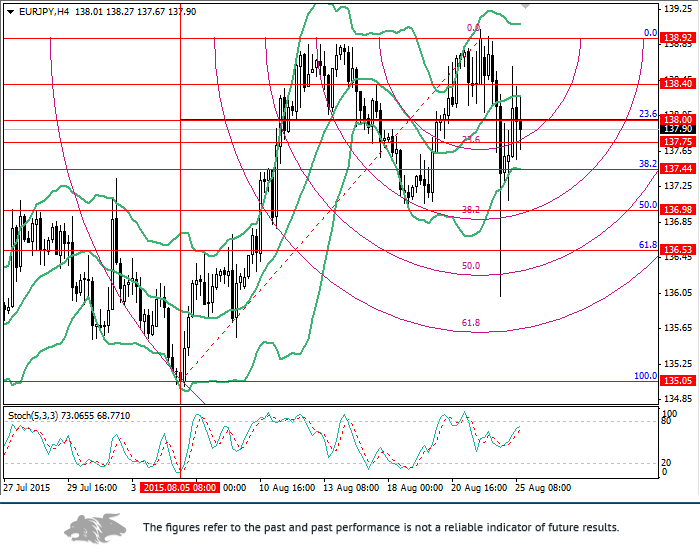
A downward correction is likely to continue.
On the 4-hour chart, the price declined below the level of 138.00 (23.6% correction) and tested 23.6% arc for the short-term trend. If the price breaks it down, a further fall to 137.44 (38.2% correction) and 136.80 (50.0% correction) should follow. If the price breaks out the level of 138.00, it may continue growing to 138.40 and 138.92 (0.0% correction). On the daily chart, the pair is trading near the area where 23.6% correction and 50.0% arc cross each other. The price is attempting to rise to 138.90. If the level of 137.33 is broken down, the price may further decline to 135.32 (38.2% correction).
Trading tips
Open short positions from the level of 137.75 with targets at 137.44, 136.98 and stop-loss at 138.00.
Alternative scenario
Open long positions after the breakout of the level of 138.00 with targets at 138.40, 138.90 and stop-loss at 137.80.