

Finding quality trading opportunities can be a challenge even for the most seasoned trader, but your system’s inherent probabilities can be improved when you begin working in multiple time frames.

For the most part, traders have a tendency to focus on the time frame that they personally are attempting to exploit. As an example, a day-trader intends to be flat at the end of every trading day. He might be watching a 5 minute or 15 minute time fame and using his system to find buy/sell points with the goal of making a smaller profit daily. However, the market he is trading might have stronger potential in one direction over time and that potential needs to be seen in context to better exploit intraday price action.
I like to compare the issue of multiple time frames to listening to a piece of music. Your ear hears EVERYTHING written by the musician as one unfolding event; you hear the rhythm, harmony and melody together and that is the music. They contribute to the overall theme separately but your ear hears the finished product as a complete event. In the markets, each individual time frame represents a certain group of traders who will eventually put price pressure into the overall market. Those traders have different goals and see the market differently over time but their force on the market needs to be understood in order to exploit the time frame with the system you choose to use. Watching only one time frame when trading is similar to listening to a piece of music but only hearing every other note and trying to make sense of what you hear. To best understand the markets potential (no matter what time frame you personally use) you need to listen to what everyone is playing.
Larger timeframes work against the smaller time frames for the most part. For example, look at the first chart where a solid downtrend is in play on the five minute timeframe in the EUROFX futures. An intraday trader might be looking to sell the market on a slight retracement somewhere around the 1.2760/80 level as the market finds overhead trend resistance. Note that the oscillator is showing overbought.
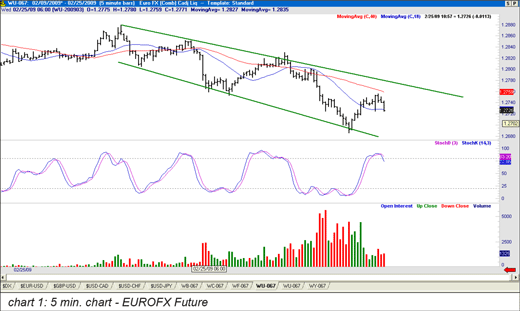
Now compare chart1 to chart2 on the 60 minute timeframe:
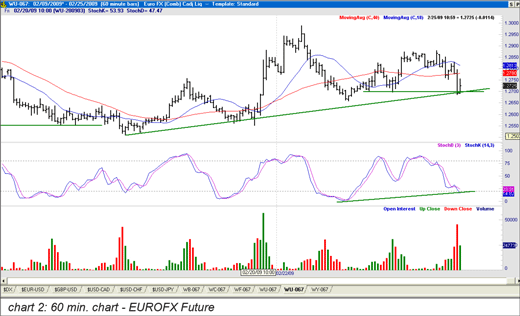
Note that the 60 minute chart shows the current price level as being a possible support zone and the oscillator has potential to become divergent should the market stabilize and rise slightly. At the moment when the smaller timeframe is retreating to a possible sell area; the larger timeframe may be on a support zone. Given the conflict between the two time frames, an intraday 5-minute time frame trader would be well advised to be cautious about a short position because the larger time frame will likely have traders looking to buy the market and possibly hold for a longer amount of time than an intraday trader will. Additionally, the intraday short-seller will likely cover before the end of the day adding to the pool of buy orders that the market must process regardless of whether or not he has a profit—because an intraday trader will always cover at the end of day (that’s what his trade plan requires).
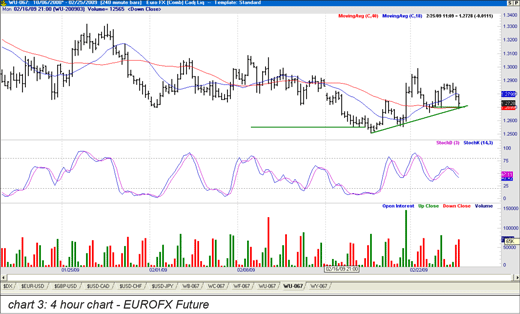
The four-hour chart shows additional potential for a near-term bottom increasing the possibility that the short would be at a greater risk:
Bear in mind, this discussion is not an exhaustive study on the potential the EUROFX has to rally from this point forward, it is intended to help the trader understand that no matter how he analyzes the market or what how sophisticated his study/approach is there is more to be learned about the entire market structure by looking at multiple time frames than by using only the time frame you intend to trade on. For the most part, my personal study has shown me that knowing what long time frame traders might be thinking can be a tremendous help to trading on a short time frame. Many low-probability trades can be avoided or liquidated faster and high probability trades can be held longer when you see the market in a larger context.
It is important to remember a few things about trading in any market. For the most part, the market is subject to the “80/20” rule common in most activities. Simply put, 20% of the participants are producing 80% of the desired results. 80% of participants are producing 20% of the results. As an example, any professional salesperson can tell you that if there are 10 salespeople working in the office, 2 of them create 80% of the sales volume. The rest take up space.
In the markets, roughly 80% of traders are experiencing a loss at any time; regardless of what their trade plan is or what time frame they operate under. Most clearing firms will tell you that roughly 80% of traders close their accounts at a loss no matter who they are or what they use to try and exploit market price action. If you were to look directly at the trading plans or results of these losing traders you will see quite clearly that losing traders tend to operate on a time frame of one hour or less. Larger traders and professional traders tend to operate on a time frame of more than one hour and in most cases a time frame of days. That means the winners (professionals and large traders) are thinking about what the market might do over days or weeks and use the hourly time frame to find their entry point. The losers tend to be day-traders attempting to make a small gain more often and attempt to analyze random noise in the market which the professional ignores.
This doesn’t mean day-trading is “wrong” or using a small time frame is “bad”. The point is that larger time frames control the market and if you intend to trade on a short time frame you need to know what the larger time frames are thinking. Otherwise, as we have seen above, your position might be in direct conflict with the actual force in the market increasing your risk of loss.
Author : Jason Alan Jankovsky


