Summery:
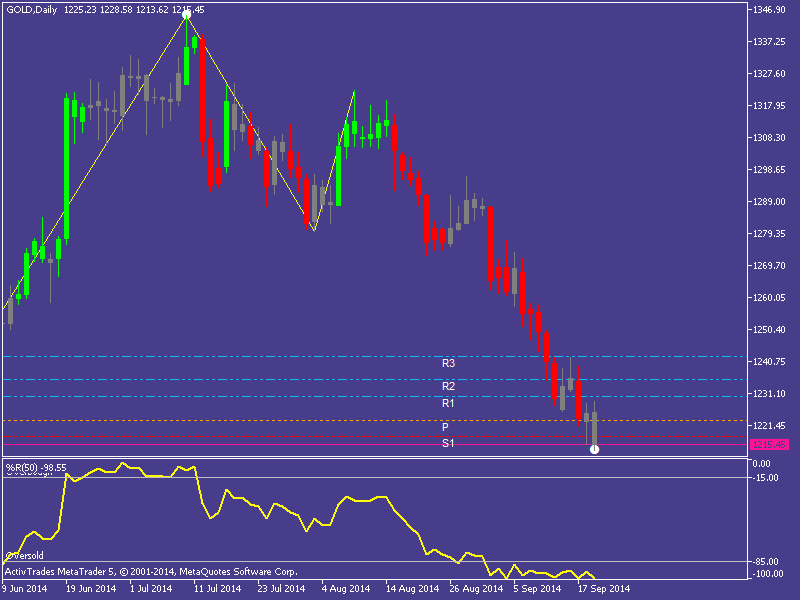
Primary Trend: Bearish (LAST LOW WHITE DOT IS NOT YET CONFIRMED)
Secondary Trend: Bearish (see last zigzag)
R1: 1229,91
S2: 1210,65
Comment: All indicators on chart show a big bearish trend. But last cancle color is Grey so we have an indecision between buyers and sellers. We may wait next bars colors to see if downtrend will change or may be confirmed. Also we see a white dot (not confirmed). It means is a down peak and we are close to the downtrend end but we should wait.
Volumes are inside the Oversold zone.
Suggestion:
If you have entered short before it may be good start thinking to close position. Otherwise is better to wait next bars and see a green candle, a breakup of R1 and exit from Oversold zone to enter long and catch a new Big Trend.
Warning: what will happen to prices no one can know, that belongs to the future.
Good Luck!


