Technical Analysis for US Dollar, S&P 500, Gold and Crude Oil - S&P 500 Threatens Range Support Below 2000 Figure

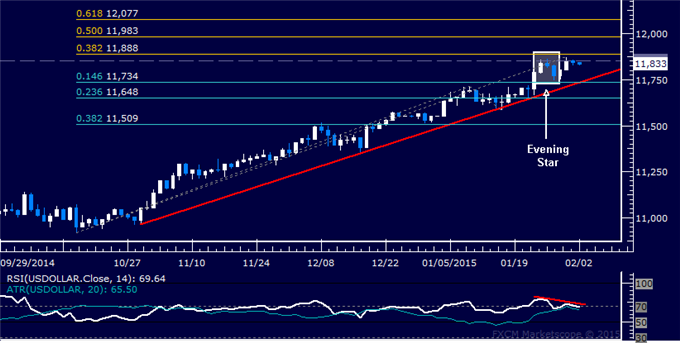
US DOLLAR TECHNICAL ANALYSIS
Prices may be readying to turn
lower after producing a bearish Evening Star candlestick pattern. A
daily close below the intersection of the 14.6% Fibonacci retracement
and a rising trend line at 11734 exposes the 23.6% level at 11648.
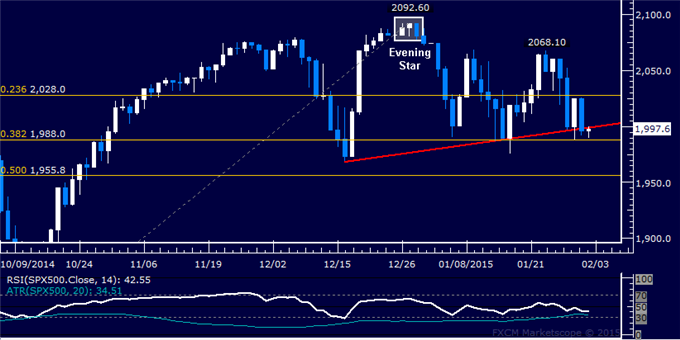
S&P 500 TECHNICAL ANALYSIS
Prices declined as expected
after putting in a bearish Evening Star candlestick pattern. A daily
close below the 38.2% Fibonacci retracement at 1988.00 exposes the 50%
level at 1955.80.
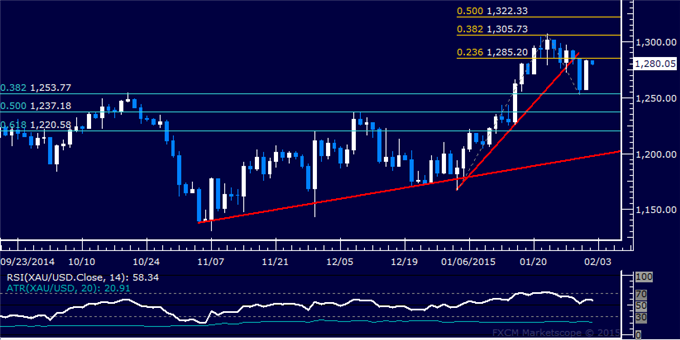
GOLD TECHNICAL ANALYSIS
Prices recoiled from
resistance-turned-support at October’s swing highs, producing the
largest daily advance in 3 weeks. A daily close above the 23.6%
Fibonacci expansion at 1285.20 exposes the 38.2% level at 1305.73.
Alternatively, a reversal below the 38.2% Fib retracement at 1253.77
targets the 50% threshold at 1237.18.
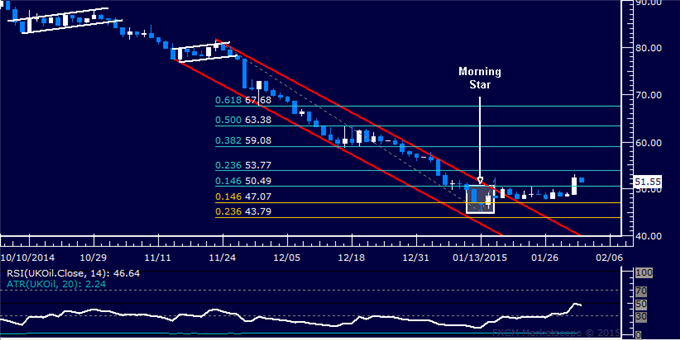
CRUDE OIL TECHNICAL ANALYSIS
Prices pushed higher following a
prolonged period of consolidation after bottoming as expected above the
$45.00/barrel figure. A daily close above the 23.6% Fibonacci
retracement at 53.77 exposes the 38.2% level at 59.08. Alternatively, a
reversal below the 14.6% Fib at 50.49 targets the 14.6% Fib expansion at
47.07.