Original post on Inovance blog. You can find the EA attached there or attached in this post; it is free and open-sourced: https://www.inovancetech.com/traide-strategy-2.html
Strategy Idea
We want to build a simple strategy that uses a 14-period CCI to time our entry and the MACD Histogram to confirm we are trading in the right direction. I chose the MACD Histogram and CCI to identify trend reversals as both indicators are generally used in this way.
We will use TRAIDE’s machine-learning algorithms to see if we can find the relationship between these two indicators and the price movement of the EUR/USD over the next 4 hours to create our entry signals. From there, we can apply our risk and money management techniques to build a robust trading strategy.
We will use the EUR/USD on a 4hr chart from January 1st, 2012 to June 1st, 2014 to build our strategy (3,902 OHLC bars) and reserve the last 6 months for out-of-sample testing in MetaTrader 4 with an EA. I have attached the EA here if you would like to test and experiment with it yourself!
Model Creation Page
- Asset: EUR/USD
- Timeframe: 4-hour
- Simulation Start: 01/01/2012 12:00 AM
- Simulation End:06/01/2014 12:00 AM
- Indicators:
- Commodity Channel Index (CCI): (default settings)
- 14 period
- MACD: Histogram: (default settings)
- Fast Moving Average Type: EMA
- Fast Period: 12
- Signal Moving Average Type: SMA
- Signal Period: 9
- Slow Moving Average Type: EMA
- Slow Period: 26
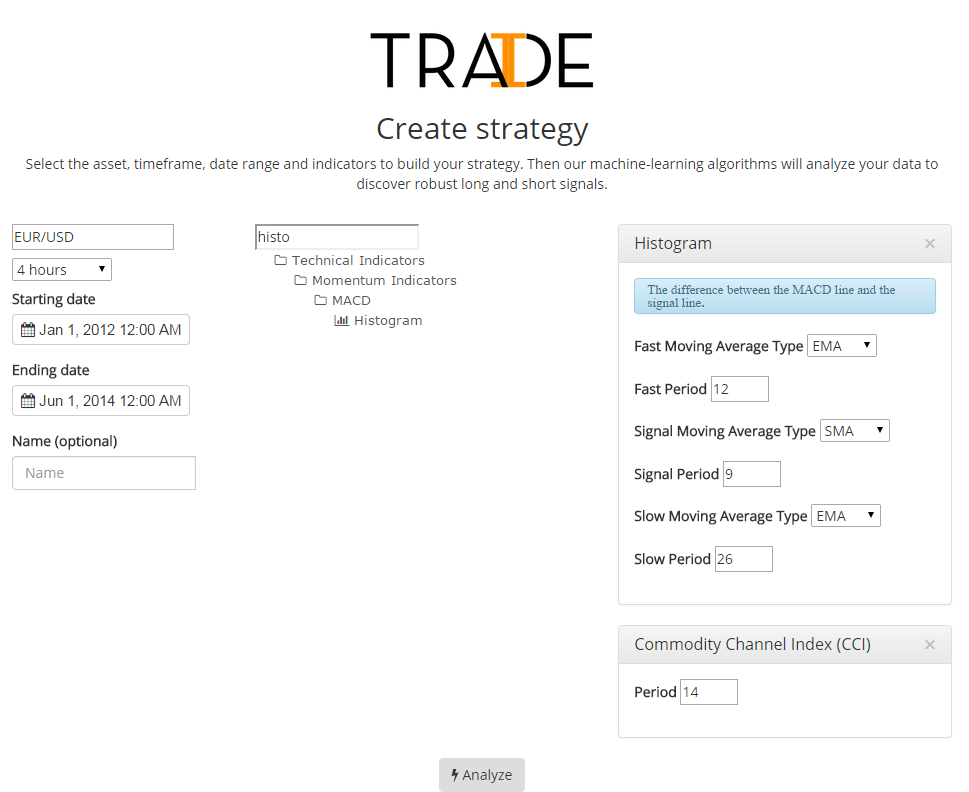
Then, all we need to do is hit analyze and let the algorithms do the hard work.
Strategy Dashboard

Long Rules
What we see right off the bat is that the CCI produced the strongest long signal. We are looking for:
- The highest ratio of the long signal strength (dark green) to the long opportunities (light green) in a single bar.
- The height difference between the long opportunities bar and short opportunities bar in a single bin (the long opportunities are always on the left side of the bin).
- The total number of opportunities in the bin (cumulative height of the long and short bars in a bin).
We’ll select the -83 bin to go long as our first condition. We can calculate the range of bin by finding the midpoint between two consecutive bin values. By going long when the CCI was between -41.5 (the midpoint between the -83 and 0.0 bin) and -124.5 (the midpoint between the -83 and -170 bin) we were able to build a fairly successful strategy: 53.27% accurate over 963 trades and about 12% return and an average return per trade of $1.18.
Let’s add conditions for the MACD Histogram. What’s interesting, and not too surprising, is the algorithm found that the MACD histogram was able to produce the strongest signal as a mean-reversion indicator, or trend reversal. We can see this by the strong buy signals generated when the MACD Histogram was negative.
We’ll select the 0.0 and -.00076 bins that best satisfy our three conditions above.
Our final long strategy is to go long when the 14-period CCI is between -41.5 and -124.5, while the MACD Histogram was less than 0.00038 (the upper edge of the 0.0 bin) and greater than -0.00114 (the lower edge of the -.00076 bin).

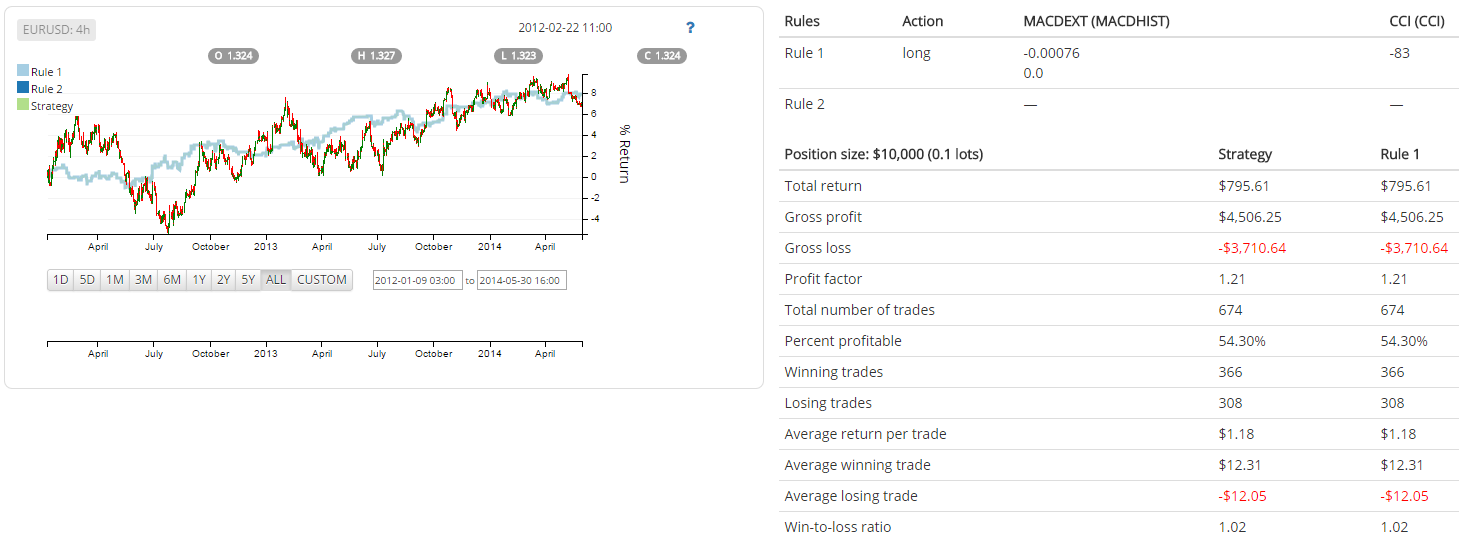
This produces a much more promising set of rules. We were able to achieve slightly less return (8%) but in only 674 trades and with the same average return per trade of $1.18 and a higher accuracy of 54.30%. Though the return per trade is the same with the added criteria from the MACD Histogram, I prefer the extra confirmation that we are in a trend reversal and the added accuracy is a nice benefit as well- giving me more room to play with my risk and money management parameters when I trade this strategy live.
Let’s repeat the process for our short rules.
Short Rules
Once again we see that the CCI provides the stronger signal. This time we will select the bin(s) that have:- A high dark red to light red ratio.
- A large difference between long and short bins.
- A large sample size.
We will select the 1.7e+2 (170) bin, setting our rules to be when the CCI is between 128.5 and 211.5 (the lower and upper edges of our bin).
With just going short within that range, we see a decent return, about 7.6%, which is about the same as a buy and hold strategy with much less volatility, with very high accuracy, 60.60%, and high return per trade of $1.76 in 434 trades.
Let’s see if we can add the MACD Histogram filter that will further increase our average return per trade and accuracy without sacrificing too much of the return.
We will select the 0.0, 0.00076 and 0.0015 bins, leading to rules of going short when the MACD Histogram is above -0.00038 (the lower edge of the 0.00 bin) and below 0.00188 (the upper edge of the 0.0015 bin).

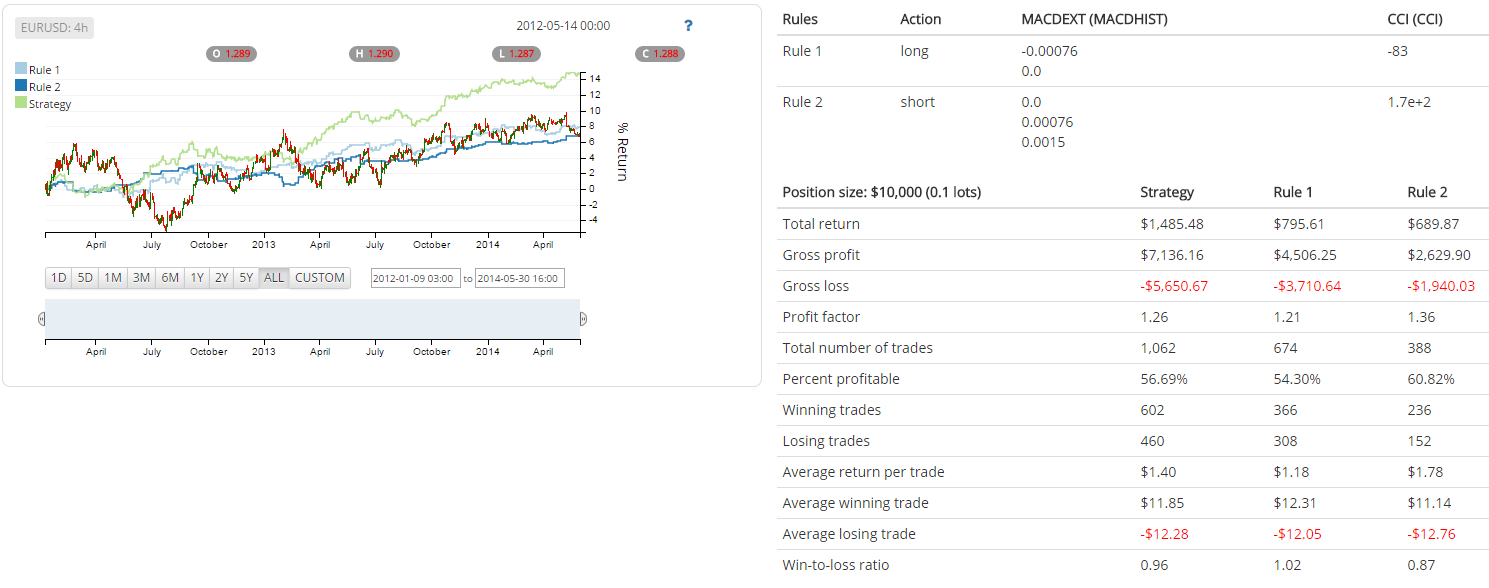
We were still able to achieve a significant over 6% return but in 388 trades, with higher accuracy, 60.82%, and most importantly, a higher average return per trade of $1.78.
Conclusion
Our final strategy reads as:| Indicator | Long | Short |
|---|---|---|
| 14-period CCI | Between -41.5 and - 124.5 | Between 128.5 and 211.5 |
| MACD Histogram | Between -0.00114 and 0.00038 | Between -0.00038 and 0.00188 |
Note: Having balanced long and short rules is a sign of a more robust strategy as we are able to decrease the directional bias. Meaning, the strategy is more likely to perform well in both bullish and bearish market conditions.
The final strategy is the result of our long and short rules. The combined rules show a return of over 14% ($1,485.48 on $10,000 position sizes (0.1 lots), 56.69% accuracy over 1,062 trades and an average return per trade $1.40, which is more than to cover $0.40 commissions an .5 pip spread.
Now that we have a strict set of rules to follow, we are able to easily automate them or use them to trade ourselves! I coded the strategy into an EA that you can play with in MT4.
You can download the EA here. This is an open-source template you can manipulate and compile yourself without any restrictions.
In the backtest, I applied a 40 pip take profit and 40 pip stop loss (if you have a 5-digit broker, make sure to change the take profit and stop loss to 400, rather than 40). After a quick backtest over 6 months of out-of-sample data, we have some fairly good performance (conservative 2 pip spread applied). We had 116 trades; 70.37% accurate for short and 50.56% accurate for long trades and a net profit of $2,558.00 on a $10,000 account.
To improve the strategy further, we can explore adding shorter period relative strength index (RSI) or rate of change (ROC) to help time our entry signals but I will let you try that out on your own.
If you would like to use TRAIDE, please email info@inovancetech.com with “Technical FX” as the subject line and we will send you a username and password or sign up for TRAIDE on the home page!

