
Price Pattern Amalysis for Gold, US Dollar, S&P 500 and Grude Oil - Gold in Consolidation Mode, Crude Oil Drops to Five-Year Low

US DOLLAR TECHNICAL ANALYSIS
Prices paused to consolidate after
producing the largest daily rally in five weeks. Near-term resistance
is at 11511, the 50% Fibonacci expansion, with a break above that on a
daily closing basis exposing the 61.8% level at 11565.

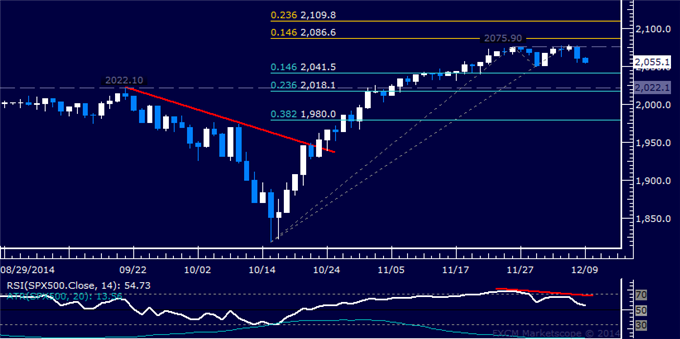
S&P 500 TECHNICAL ANALYSIS
Prices began to turn lower as
expected. A drop below the 2041.50-49.10 area marked by the 14.6%
Fibonacci retracement and the December 1 low exposes the 2018.10-22.10
zone (23.6% level, September 19 high).
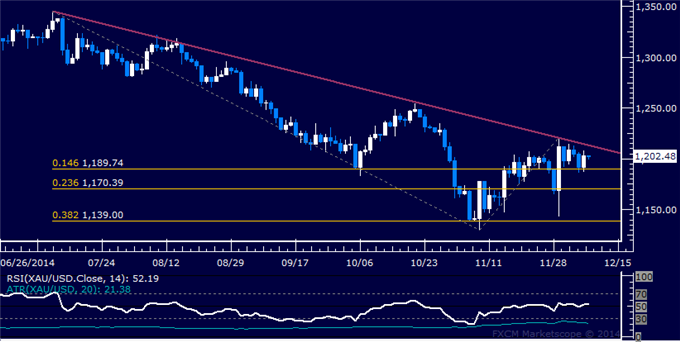
GOLD TECHNICAL ANALYSIS
Prices met resistance at a falling
trend line set from early July. A break below the 14.6% Fibonacci
expansion at 1189.74 exposes the 23.6% level at 1170.39.
CRUDE OIL TECHNICAL ANALYSIS
Prices are testing below support
at 65.96, the 50% Fibonacci expansion. A daily close below this barrier
exposes the 61.8% level at 64.30.


