EURCAD Technical Analysis - Monthly Forecast for 2015: Ranging Bullish
26 November 2014, 21:11
0
209
MN price.
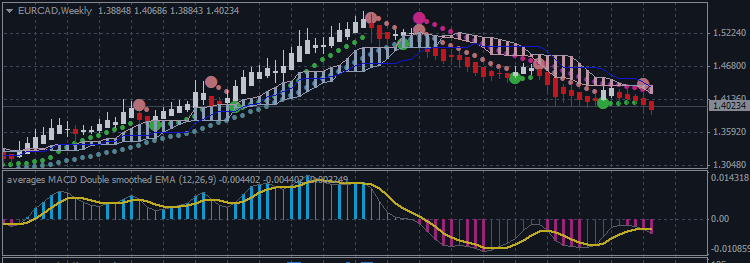
Ichimoku Analysis
The
price is located inside Ichimoku cloud/kumo and above Senkou Span A line which is indicating the secondary ranging and correction with the primary bullish market condition.
- If the MN price will break Senkou Span A line from above to below so we may see the reversal of the price movement from primary bullish to the primary bearish condition.
- If this line will cross Senkou Span B line from below to above so the secondary correction will be finished and the primary bullish will be continuing (good to open buy trade for example).
Support & Resistance Analysis
The nearest resistance line is 1.4953 which is located above Ichimoku cloud/kumo, and the key support level is 1.4011 which is located in the middle of kumo.

- If
MN1 price will break 1.4953 resistance level on close
monthly bar so the primary bullish breakout will be started.
- If MN1 price will cross 1.4011 support level so the secondary correction within the primary bullish market condition will be continuing.
- If MN1 price will break 1.2989 support level (Senkou Span A) so it will be the reversal of the price movement from primary bullish to the primary bearish market condition as continuation of the secondary correction for example.
| Resistance | Support |
|---|---|
| 1.4953 | 1.4011 |
| 1.5585 | 1.2989 |
To make it shorter - I am expecting the ranging market condition for 2015 for this pair.
Trading Summary: ranging bullish
If we look at patterns for MN1 timeframe so we can see the formed Retracement pattern for downtrend:


