
Indicadores tricolores y algunas oportunidades para una simplificación máxima de la escritura de los indicadores
Introducción
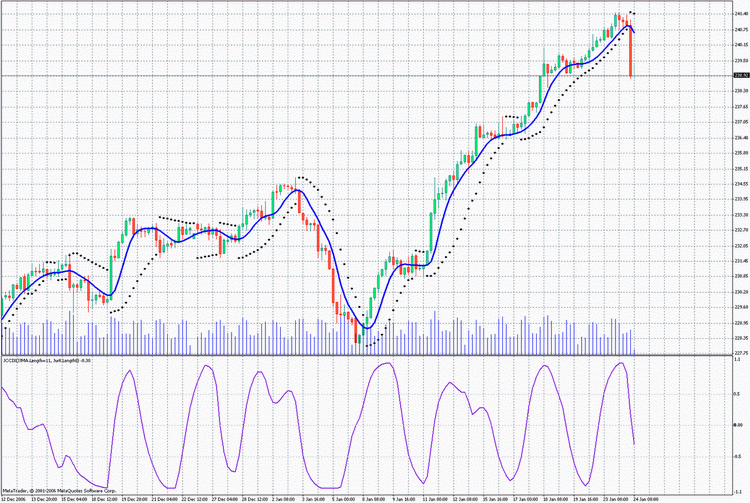
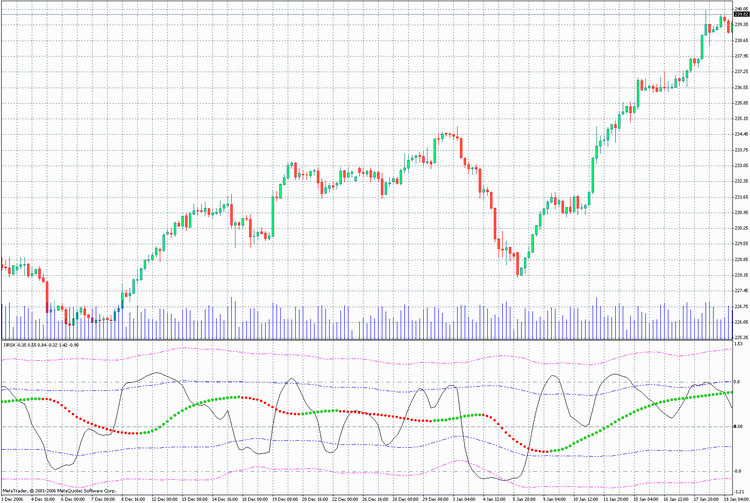
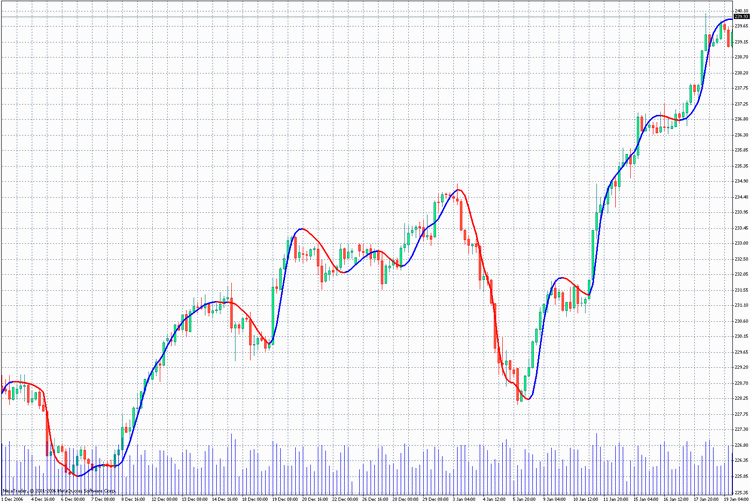
En muchos casos, la mejor fuente de información sigue siendo el color. Cambia las señales muy vívidamente y con rapidez en relación con los cambios actuales en las características del mercado. Por esa razón los indicadores de tendencia tricolores parecen ser con mucha frecuencia más informativos y eficientes que sus análogos monocromos. Tan solo vea el ejemplo representado en dos variantes:
En una versión normal con indicadores sin colores de la dirección de la tendencia:
y una versión en la que los indicadores tienen colores que los diferencian en función de la dirección de la tendencia:
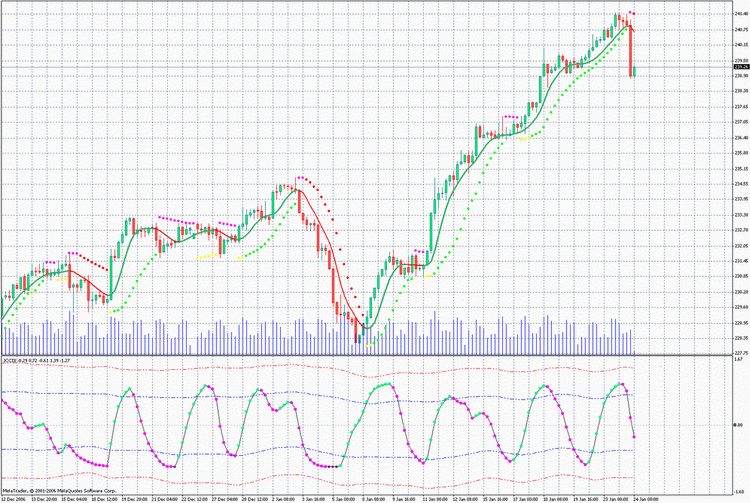
Puede ver que es más fácil y claro trabajar con el segundo gráfico. La creación de dichos indicadores en MQL4 no causará ningún problema. No hay un aumento considerable en el consumo de recursos. Por tanto, si no se aprovecha esta oportunidad en el trading, se perderá la posibilidad de simplificar el trabajo extenuante de una observación constante de la situación del mercado.
Vamos a aprender a crear dichos indicadores.
Indicador tricolor 3c_JJRSX1
En primer lugar vamos a crear un diagrama lineal tricolor basado en el oscilador JJRSX:
iCustom(NULL,0,"JJRSX",Length,Smooth,Smooth_Phase,
        Input_Price_Customs,0,bar).
No debería haber ningún problema al escribir un análogo tricolor que señalice un cambio de tendencia usando el color:
/*
For the operation of the indicator place the files
JJMASeries.mqh
JurXSeries.mqh
PriceSeries.mqh
into the folder (directory): MetaTrader\experts\include\
Heiken Ashi#.mq4
into the folder (directory): MetaTrader\indicators\
*/
//+------------------------------------------------------------------+
//|                                                    3c_JJRSX1.mq4 |
//|                           Copyright c 2006,     Nikolay Kositsin |
//|                              Khabarovsk,   farria@mail.redcom.ru |
//+------------------------------------------------------------------+
#property copyright "Copyright c 2006, Nikolay Kositsin"
#property link      "farria@mail.redcom.ru"
//---- drawing the indicator in a separate window
#property indicator_separate_window
//---- number of the indicator buffers
#property indicator_buffers  3
//---- colors of the indicator
#property indicator_color1  BlueViolet
#property indicator_color2  Magenta
#property indicator_color3  Gray
//---- width of the indicator lines
#property indicator_width1 3
#property indicator_width2 3
#property indicator_width3 3
//---- parameters of the horizontal levels of the indicator
#property indicator_level1  0.5
#property indicator_level2 -0.5
#property indicator_level3  0.0
#property indicator_levelcolor MediumBlue
#property indicator_levelstyle 4
//---- INPUT PARAMETERS OF THE INDICATOR
extern int        Length = 8;  // depth of the indicator smoothing
extern int        Smooth = 3; // depth of the additional JMA smoothing
// changing within the limits -100 ... +100,
// influences the quality of the transient process;
extern int  Smooth_Phase = 100;
/* Selecting prices, based on which the indicator will be calculated
(0-CLOSE, 1-OPEN, 2-HIGH, 3-LOW, 4-MEDIAN, 5-TYPICAL, 6-WEIGHTED,
7-Heiken Ashi Close, 8-SIMPL, 9-TRENDFOLLOW, 10-0.5*TRENDFOLLOW,
11-Heiken Ashi Low, 12-Heiken Ashi High, 13-Heiken Ashi Open,
14-Heiken Ashi Close.) */
extern int Input_Price_Customs = 0;
//---- indicator buffers
double Ind_Buffer1[];
double Ind_Buffer2[];
double Ind_Buffer3[];
//+------------------------------------------------------------------+
//| JJRSX initialization function                                    |
//+------------------------------------------------------------------+
int init()
  {
// styles of drawing the indicator
   SetIndexStyle(0,DRAW_HISTOGRAM, STYLE_SOLID);
   SetIndexStyle(1,DRAW_HISTOGRAM, STYLE_SOLID);
   SetIndexStyle(2,DRAW_HISTOGRAM, STYLE_SOLID);
// 4 indicator buffers are used for calculation
   SetIndexBuffer(0,Ind_Buffer1);
   SetIndexBuffer(1,Ind_Buffer2);
   SetIndexBuffer(2,Ind_Buffer3);
// setting the indicator values, which will be invisible on the chart
   SetIndexEmptyValue(0,0);
   SetIndexEmptyValue(1,0);
   SetIndexEmptyValue(2,0);
// names for window data and labels for subwindows
   SetIndexLabel(0,"Up_Trend");
   SetIndexLabel(1,"Down_Trend");
   SetIndexLabel(2,"Straight_Trend");
   IndicatorShortName("JJRSX(Length="+Length+")");
// Setting the format of accuracy (number of signs after a decimal point)
//for the visualisation of the indicator values
   IndicatorDigits(0);
// correction of the invalid value of the parameter Length
  if(Length<1)Length=1;
// setting the bar number, starting from which the indicator will be drawn
   int draw_begin=3*Length+30+1;
   SetIndexDrawBegin(0,draw_begin);
   SetIndexDrawBegin(1,draw_begin);
   SetIndexDrawBegin(2,draw_begin);
//---- end of the initialization
return(0);
  }
//+------------------------------------------------------------------+
//| JJRSX iteration function                                         |
//+------------------------------------------------------------------+
int start()
  {
// Declaration of the integer statistic variables
   static int time2;
// Declaration of the decimal static variables
   static double ValueM;
// Declaration of the decimal variables
    double Value0,Value1,trend;
// Declaration of the integer variables and retrievement of the calculated bars
    int bar,limit,MaxBar,Tnew,counted_bars=IndicatorCounted();
// check for errors
    if (counted_bars<0)return(-1);
// the last calculated bar should be recalculated
    if (counted_bars>0) counted_bars--;
// defining the number of the oldest bar,
// starting from which all bars will be recalculated
    MaxBar=Bars-3*Length-30;
    //---- defining the number of the oldest bar,
    //starting from which all new bars will be recalculated
    limit=Bars-counted_bars-1;
    //+--- zero initialization
    if (limit>=MaxBar)
      for(bar=Bars-1;bar>=MaxBar;bar--)
       {
        limit=MaxBar;
        Ind_Buffer1[bar]=0.0;
        Ind_Buffer2[bar]=0.0;
        Ind_Buffer3[bar]=0.0;
       }
//+--- retrieving the variable values
    Tnew=Time[limit+1];
    if (limit<MaxBar)
    if (Tnew==time2)
     {
      Value1=ValueM;
     }
    else
     {
      if (Tnew>time2)
           Print("Error in retrieving variables!!! Tnew>time2");
      else Print("Error in retrieving variables!!! Tnew");
      Print("Indicators will be recounted on all bars!!");
      return(-1);
     }
//----+ THE MAIN CYCLE OF CALCULATING INDICATORS
    while (bar>=0)
      {
       //+--- Saving the variables values +====+
     if (bar==1)
      {
       if(((limit==1)&&(time2==Time[2]))||(limit>1))
         {
          ValueM=Value1;
          time2=Time[bar];
         }
      }
     //+---+====================================+
        Value0=iCustom(NULL,0,"JJRSX",Length,Smooth,Smooth_Phase,
                       Input_Price_Customs,0,bar);
        if (bar==MaxBar)
          {
           Value1=Value0;
           continue;
          }
        //---- Tricolor indicator code
        trend=Value0-Value1;
        if(trend>0)
          {
            Ind_Buffer1[bar]=Value0;
            Ind_Buffer2[bar]=0;
            Ind_Buffer3[bar]=0;
          }
        else
          {
            if(trend<0)
              {
                Ind_Buffer1[bar]=0;
                Ind_Buffer2[bar]=Value0;
                Ind_Buffer3[bar]=0;
              }
            else
              {
                Ind_Buffer1[bar]=0;
                Ind_Buffer2[bar]=0;
                Ind_Buffer3[bar]=Value0;
              }
          }
        //----
        Value1=Value0;
        //----+
        bar--;
     }
    //---- end of the calculation of the indicator values
    return(0);
  }
//+--------------------------------------------------------------+
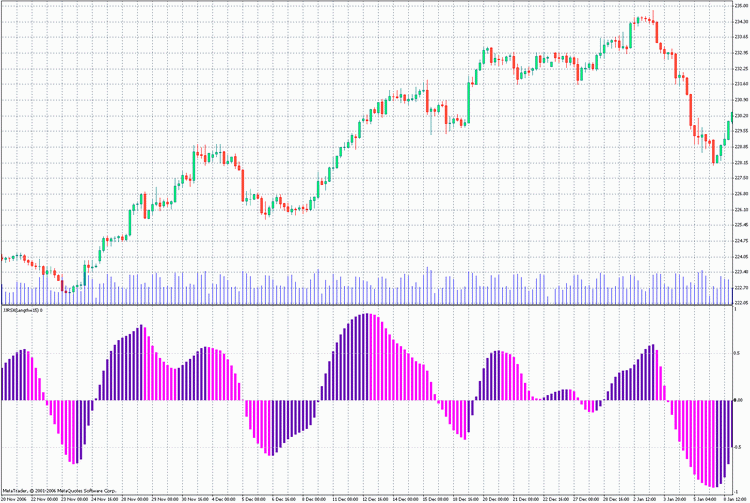
Se usan tres búferes de indicador para el indicador, y para los valores del código del indicador JJRSX sobre la primera barra se usa el valioso Value1. No se pierde el valor de la variable Value1 entre los ticks, se guarda en la variable estática ValueM. El algoritmo del indicador compara el valor actual del indicador con el valor de la barra anterior y coloca este valor en el búfer del indicador necesario. Para realizar un indicador análogo sobre la base de otro indicador personalizado, solo necesita cambiar el nombre del indicador personalizado en la línea de la referencia al indicador personalizado:
Value0=iCustom(NULL,0,"JJRSX",Length,Smooth,Smooth_Phase,
               Input_Price_Customs,0,bar);
En la línea
MaxBar = Bars - 3*Length - 30;
cambie la fórmula de cálculo y cambie también la fórmula de cálculo en la línea
int draw_begin = 3*Length + 30 + 1;
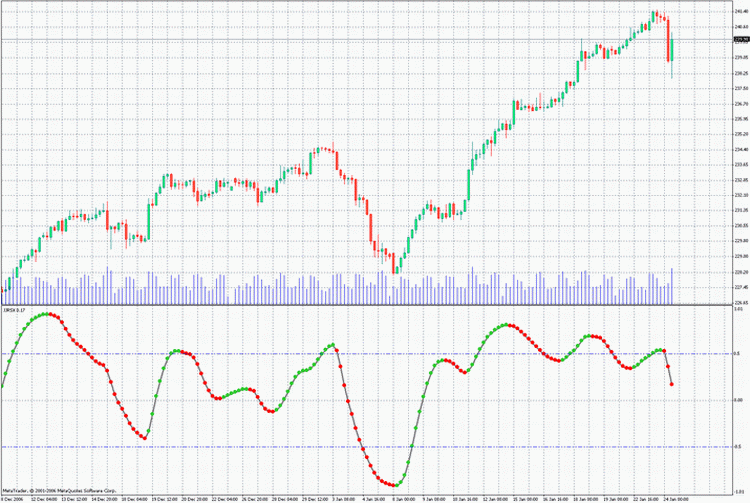
en el bloque de inicialización. Y, por supuesto, cambie las variables externas por las necesarias. Puede hacer que el gráfico sea más informativo añadiendo el indicador BollingerBands y la opción de cambiar el formulario del indicador de lineal a diagrama de puntos. Además, usar este indicador como plantilla traerá algunos inconvenientes en la búsqueda de las líneas necesarias a cambiar en el código del programa, que no cambiarán en otros gráficos tricolores. Sería más racional colocar el código de este programa en un archivo mqh y usarlo en el indicador que utiliza el operador #include. Vamos a hacerlo. En este caso, el código del indicador toma una forma simple sin ningún elemento excesivo. Se usa fácilmente como plantilla para escribir otros diagramas de oscilador:
/*
For the operation of the indicator place files
JJMASeries.mqh
PriceSeries.mqh
3c_BB_Osc.mqh
into folder (directory): MetaTrader\experts\include\
JJRSX.mq4
Heiken Ashi#.mq4
nto folder (directory): MetaTrader\indicators\
*/
//+------------------------------------------------------------------+
//|                                                     3c_JJRSX.mq4 |
//|                               Copyright © 2006, Nikolay Kositsin |
//|                              Khabarovsk,   farria@mail.redcom.ru |
//+------------------------------------------------------------------+
#property copyright "Copyright © 2006, Nikolay Kositsin"
#property link      "farria@mail.redcom.ru"
//---- drawing the indicator in a separate window
#property indicator_separate_window
//---- number of the indicator buffers
#property indicator_buffers 8
//---- colors of the indicator
#property indicator_color1 Gray
#property indicator_color2 LimeGreen
#property indicator_color3 Red
#property indicator_color4 Purple
//---- Bollinger Bands colors
#property indicator_color5 Blue
#property indicator_color6 Blue
#property indicator_color7 Magenta
#property indicator_color8 Magenta
//---- width of the indicator lines
#property indicator_width1 2
#property indicator_width2 2
#property indicator_width3 1
#property indicator_width4 1
//---- style of the envelope line
#property indicator_style1 4
//---- style of Bollinger Bands line
#property indicator_style5 4
#property indicator_style6 4
#property indicator_style7 4
#property indicator_style8 4
//---- parameters of horizontal lines of the indicator
#property indicator_level1 0.0
#property indicator_levelcolor SteelBlue
#property indicator_levelstyle 4
//---- INPUT PARAMETERS OF THE INDICATOR
extern int  Length = 8;  // depth of JurX indicator smoothing
// depth of JJMA smoothing of the retrieved indicator
extern int  Smooth = 3;
// parameter changing within limits -100 ... +100, influences
// the quality of transient processes of smoothing
extern int  Phase = 100;
/* Selecting colors, based on which the indicator is calculated
(0-CLOSE, 1-OPEN, 2-HIGH, 3-LOW, 4-MEDIAN, 5-TYPICAL, 6-WEIGHTED,
7-Heiken Ashi Close, 8-SIMPL, 9-TRENDFOLLOW, 10-0.5*TRENDFOLLOW,
11-Heiken Ashi Low, 12-Heiken Ashi High,  13-Heiken Ashi Open,
14-Heiken Ashi Close.) */
extern int Input_Price_Customs = 0;
//---- Declaration of the function COUNT_begin() for counting the bar number,
// starting from which the indicator will be drawn and
// Bollinger Bands wikk be calculated
int COUNT_begin()
{int count_begin=2*Length+30;return(count_begin);}
//---- declaration of the function digits() for setting the accuracy format
// (number of signs after a decimal point) for the visualization
// of the indicator values
int digits(){return(2);}
//---- setting the indicator values, which will be invisible on the chart
int EmptyValue=0.0;
//---- Declaration of the name of the indicator
string Label = "JJRSX";

//---- Including into the indicator text its main text
#include <3c_BB_Osc.mqh>
//---- declaration of the function INDICATOR
//---- reference to the source indicator for retrieving the source values
double INDICATOR(int INDICATOR.bar)
 {
  return(iCustom( NULL, 0, "JJRSX", Length, Smooth, Phase,
         Input_Price_Customs, 0, INDICATOR.bar) );
 }
//---- ---------------------------------------------------------------+
El código adicional se coloca en el archivo 3c_BB_Osc.mqh y se representa en el indicador por una sola línea
#include <3c_BB_Osc.mqh>
El archivo mqh contiene solo las variables externas para las bandas de Bollinger y para elegir el estilo de la presentación del gráfico. Naturalmente, el archivo 3c_BB_Osc.mqh debe colocarse en la carpeta: \MetaTrader\EXPERTS\INCLUDE.
El algoritmo de creación de un indicador tricolor
Ahora, para crear un oscilador tricolor nuevo, solo necesitamos guardar este archivo con un nuevo nombre en la carpeta \MetaTrader\EXPERTS\indicators y hacer los cambios siguientes:
1. Elegir los colores deseados para los elementos del indicador y otros parámetros;
2. Insertar nuevos parámetros de entrada del indicador, copiándolos del indicador personalizado;
3. Insertar en la función COUNT_begin() una fórmula para contar una barra de inicio (normalmente es suficiente insertar la variable externa del indicador, lo que determina el periodo o suma de esta variable con la variable, realizando el ajuste adicional del oscilador);
4. Insertar en la línea
digits()
  {
    return(2);
  }
el valor necesario de la precisión del indicador. Si el indicador cambia de 0 a 100, insertamos cero y si el indicador cambia de 0 a1, insertamos 2 (dos signos después del punto decimal);
5. Configuramos los valores del indicador que serán visibles en el gráfico;
6. Crear un nombre para el indicador;
7. Insertar la referencia al indicador personalizado iCustom(). Después, compilamos el código y el indicador estará listo.
Una cosa más que puede que quiera cambiar es un leve ajuste de la forma del oscilador. Para este caso solo necesita añadir la letra "J" al nombre del archivo mqh en el texto del indicador: era:
#include <3c_BB_Osc.mqh>
ahora
#include <3c_BBJ_Osc.mqh>
En la compilación del archivo con JMA se usará el ajuste del oscilador personalizado.
Un indicador tricolor 3c_JJRSX2
Puede mejorar más el indicador. Sería más conveniente añadir un JJRSX rápido monocromo más, sería bastante razonable. Vamos a dividir el indicador por el análogo del ejemplo en dos partes, colocando en el archivo mqh la parte del código que simplifica al máximo la percepción del indicador (3c_BB_Osc2. mqh):
/*
For the operation of the indicator place the files
JJMASeries.mqh
JurXSeries.mqh
PriceSeries.mqh
3c_BB_Osc2.mqh
into the folder (directory): MetaTrader\experts\include\
JJRSX.mq4
Heiken Ashi#.mq4
into the folder (directory): MetaTrader\indicators\
*/
//+------------------------------------------------------------------+
//|                                                    3c_JJRSX2.mq4 |
//|                               Copyright c 2006, Nikolay Kositsin |
//|                              Khabarovsk,   farria@mail.redcom.ru |
//+------------------------------------------------------------------+
#property copyright "Copyright c 2006, Nikolay Kositsin"
#property link      "farria@mail.redcom.ru"
//---- drawing the indicator in a separate window
#property indicator_separate_window
//---- the number of the indicator buffers
#property indicator_buffers 8
//---- colors of the indicator
#property indicator_color1 Gold
#property indicator_color2 LimeGreen
#property indicator_color3 Red
#property indicator_color4 Purple
//---- Bollinger Bands colors
#property indicator_color5 Blue
#property indicator_color6 Blue
#property indicator_color7 Magenta
#property indicator_color8 Magenta
//---- width of the indicator lines
#property indicator_width1 1
#property indicator_width2 2
#property indicator_width3 1
#property indicator_width4 1
//---- style of the envelope line
#property indicator_style1 4
//---- style of Bollinger Bands lines
#property indicator_style5 4
#property indicator_style6 4
#property indicator_style7 4
#property indicator_style8 4
//---- parameters of the horizontal levels of the indicator
#property indicator_level1  0.0
#property indicator_level2  0.8
#property indicator_level3 -0.8
//---- INPUT PARAMETERS OF THE INDICATOR
//---- input parameters of the quick monochromic JJRSX
extern int  Length1 = 8;  // depth of JurX smoothing of the indcator
// depth of JJMA smoothing of the retrieved indicator
extern int  Smooth1 = 3;
// parameter changing within limits -100 ... +100,
//influences the quality of transient process of smoothing
extern int  Phase1 = 100;
//Selecting prices, based on which the indicator will be calculated
extern int Input_Price_Customs1 = 0;
/*(0-CLOSE, 1-OPEN, 2-HIGH, 3-LOW, 4-MEDIAN, 5-TYPICAL, 6-WEIGHTED,
7-Heiken Ashi Close, 8-SIMPL, 9-TRENDFOLLOW, 10-0.5*TRENDFOLLOW,
11-Heiken Ashi Low, 12-Heiken Ashi High,  13-Heiken Ashi Open,
14-Heiken Ashi Close.) */
//---- input parameters of the slow tricolor JJRSX
extern int  Length2 = 40;  // depth of JurX smoothing of the inidcator
// depth of JJMA smoothing of the retrieved indicator
extern int  Smooth2 = 12;
// parameter changing within limits -100 ... +100,
// influences the quality of transient process of smoothing
extern int  Phase2 = 100;
// Selecting prices, based on which the indicator will be calculated
extern int Input_Price_Customs2 = 0;
/*(0-CLOSE, 1-OPEN, 2-HIGH, 3-LOW, 4-MEDIAN, 5-TYPICAL, 6-WEIGHTED,
7-Heiken Ashi Close, 8-SIMPL, 9-TRENDFOLLOW, 10-0.5*TRENDFOLLOW,
11-Heiken Ashi Low, 12-Heiken Ashi High,  13-Heiken Ashi Open,
14-Heiken Ashi Close.)*/
//---- The style of performing the horizontal lines of the indicators
extern int    Levels_Style = 3;         // Style of levels lines
extern int    Levels_Width = 0;         // Width of leevls lines
extern color  Levels_Color = SlateGray; // color of levels lines
//---- Declaration of the function COUNT_begin() for counting the bar number,
// starting from which the indicator will be drawn and
// Bollinger Bands will be calculated
int COUNT_begin(){int count_begin=2*Length2+30;return(count_begin);}
//---- declaration of the function digits() for setting the accuracy format
//(number of signs after the decimal point) for the visualization of the
//indicator values
int digits(){return(2);}
//---- setting the indicator values, which will be invisible on the chart
int EmptyValue=0.0;
//---- Determining the indicator name
string Label = "JJRSX";

//---- Including into the indicator text its main text
#include <3c_BB_Osc2.mqh>
//---- declaration of the function INDICATOR1
//---- reference to the source indicator for retrieving source values
double INDICATOR1(int INDICATOR1.bar)
 {
  return(iCustom( NULL, 0, "JJRSX", Length1, Smooth1, Phase1,
         Input_Price_Customs1, 0, INDICATOR1.bar) );
 }
//---- declaration of the function INDICATOR2
//---- reference to the source indicator for retrieving source values
double INDICATOR2(int INDICATOR2.bar)
 {
  return(iCustom( NULL, 0, "JJRSX", Length2, Smooth2, Phase2,
         Input_Price_Customs2, 0, INDICATOR2.bar) );
 }
//---- --------------------------------------------------------------+
El código del indicador no ha sido mucho más complicado, ahora incluye dos referencias al indicador personalizado JJRSX y dos grupos de los parámetros del indicador externo iguales al número de indicadores JJRSX. No debería haber ningún problema al usar estos indicadores como plantillas para crear gráficos similares basados en otros osciladores.
Medias móviles tricolores
Vamos a hacer hincapié ahora en las variantes de la escritura de medias móviles tricolores. A primera vista, podríamos escribir un código absolutamente análogo al descrito en el primer ejemplo. Pero el gráfico anterior puede tener un inconveniente: si la dirección del desplazamiento cambia en cada barra, habrá una yuxtaposición de colores, lo que no es normal. La única forma de evitar este inconveniente es usar tres búferes más. No es probable que tres búferes adicionales hagan que ese indicador sea mucho más largo, si el código adicional se coloca en un archivo mqh. Respecto a la escritura de una media móvil tricolor, será idéntica a las anteriores:
/*
For the operation of the indicator place files
JJMASeries.mqh
PriceSeries.mqh
3Color.mqh
into folder (directory): MetaTrader\experts\include\
J2JMA.mq4
into folder (directory): MetaTrader\experts\indicators\
*/
//+------------------------------------------------------------------+
//|                                                     3c_J2JMA.mq4 |
//|                           Copyright c 2006,     Nikolay Kositsin |
//|                              Khabarovsk,   farria@mail.redcom.ru |
//+------------------------------------------------------------------+
#property copyright "Copyright c 2006, Nikolay Kositsin"
#property link "farria@mail.redcom.ru"
//---- drawing the indicator in the main window
#property indicator_chart_window
//---- number of indicator buffers
#property indicator_buffers 6
//---- indicator colors
#property indicator_color1 Blue
#property indicator_color2 Blue
#property indicator_color3 Red
#property indicator_color4 Red
#property indicator_color5 Gray
#property indicator_color6 Gray
//---- INPUT PARAMETERS OF THE INDICATOR
extern int Length1 = 5;   // depth of the first smoothing
extern int Length2 = 5;   // depth of the second smoothing
// parameter of the first smoothing, changing within limits -100 ... +100,
//influences the quality of the transient process;
extern int Phase1  = 100;
// parameter of the second smoothing, changing within limits -100 ... +100,
//influences the quality of the transient process;
extern int Phase2  = 100;
/* Choosing prices, based on which the indicator is calculated
(0-CLOSE, 1-OPEN, 2-HIGH, 3-LOW, 4-MEDIAN, 5-TYPICAL, 6-WEIGHTED,
7-Heiken Ashi Close, 8-SIMPL, 9-TRENDFOLLOW, 10-0.5*TRENDFOLLOW,
11-Heiken Ashi Low, 12-Heiken Ashi High,  13-Heiken Ashi Open,
14-Heiken Ashi Close.) */
extern int Input_Price_Customs = 0;
//---- declaration of the function digits() to set up the accuracy format
// (number of signs after the decimal point) for the visualization of the
// indicator values
int digits(){return(Digits);}
//---- Declaration of the function COUNT_begin() for calculation of the bar number,
//starting from which the indicator will be drawn
int COUNT_begin(){return(60);}
//---- setting the indicator parameters, which will be invisible on the chart
int  EmptyValue=0;
//---- lable for the indicator
string Label="J2JMA";
//---- inserting into the indicator text its main text
#include <3Color.mqh>
//---- declaration of the function INDICATOR
//---- reference to the source indicator to retrieve source values
double INDICATOR(int INDICATOR.bar)
 {
  return(iCustom(NULL,0,"J2JMA",Length1,Length2,Phase1,Phase2,0,
         Input_Price_Customs,0,INDICATOR.bar) );
 }
//---- --------------------------------------------------------------+
Debe recordarse que para las medias móviles no debemos cambiar nada cuando establecemos el formato de precisión para las medias móviles.
int digits()
  {
    return(Digits);
  }
Si la media móvil que queremos presentar en una variante de tres colores no es estable, puede ajustarse fácilmente. Tan solo añada en la línea
#include <3Color.mqh>
la letra "J". Obtenemos:
#include <3ColorJ.mqh>
Plantillas de indicador sobre la base de mayores periodos de tiempo
Esas son dos plantillas de indicador más, creadas sobre la base de un periodo de tiempo mayor, que pueden ser creadas también en base a cualquier media móvil u oscilador:
//----+ - - - - - - - - - - - - - - - - - - - - - - - - - - - - - - -+
//Version  July 1, 2006                                              |
//Editing   Nikolay Kositsin  15.06.2006  farria@mail.redcom.ru      |
//----+ - - - - - - - - - - - - - - - - - - - - - - - - - - - - - - -+
/*
Building a moving average on the current timeframe based on another,
larger timeframe. Attention!!! Indicator values are recalculated not
on the last bar, but on the number of bars, equivalent to a
candlestick of the large timeframe!

For the operation of the indicator place files
JJMASeries.mqh
PriceSeries.mqh
HTF.mqh
into folder (directory): MetaTrader\experts\include\
J2JMA.mq4
Heiken Ashi#.mq4
into folder (directory): MetaTrader\indicators\
*/
//+------------------------------------------------------------------+
//|                                                    J2JMA_htf.mq4 |
//|                            Copyright c 2005, GS  Conversion only |
//|                    http://www.gustis.narod.ru/;     gsb51@mail.ru |
//+------------------------------------------------------------------+
#property copyright "  Copyright c 2005, GS  Conversion only"
#property link      " http://www.gustis.narod.ru/;     gsb51@mail.ru"
//---- drawing the indicator in the main window
#property indicator_chart_window
//---- number of indicator buffers
#property indicator_buffers  4
//---- indicator colors
#property indicator_color1 BlueViolet
#property indicator_color2 Lime
#property indicator_color3 Red
#property indicator_color4 Gray
//---- width of indicator lines
#property indicator_width1 3
#property indicator_width2 1
#property indicator_width3 1
#property indicator_width4 3
//---- style of indicator lines
#property indicator_style1 0
//---- INPUT PARAMETERS OF THE INDICATOR
//Parameters of custom indicator iCustom
extern int Length1 = 5;   // depth of the first smoothing
extern int Length2 = 5;   // depth of the second smoothing
// parameter of the first smoothing, changing within limits -100 ... +100,
//influences the quality of the transient process;
extern int Phase1  = 100;
// parameter of the second smoothing, changing within limits -100 ... +100,
//influences the quality of the transient process;
extern int Phase2  = 100;
//Choosing prices, based on which the indicator is calculated
extern int Input_Price_Customs = 0;
/*
//---- INPUT PARAMETERS HTF +--------------------------------------------+
extern int  TFrame_Period = 240; // The larger period in minutes
// smoothing of the moving average. The most optimal value is equal
// to the relation of the larger timeframe periods to the chart period
extern int         Smooth = 48;
extern bool Trend_Visible = true;// visualization of the trend indication
// minimal speed of the moving average, considered as a trend
extern int  Trend_Minimum = 5;
extern int         Shift  = 0;   // shift of the indicator along the time axis
*/
//---- declaration of the function digits() to set up the accuracy format
// (number of signs after the decimal point) for the visualization of the
// indicator values
int digits(){return(Digits);}
//---- setting the indicator parameters, which will be invisible on the chart
int EmptyValue=0;
string Label="J2JMA";
//---- inserting into the indicator text its main text
#include <HTF.mqh>
//---- declaration of the function INDICATOR
//---- reference to the source indicator to retrieve source values
double INDICATOR(int INDICATOR.bar)
 {
  return(iCustom(NULL,TFrame_Period,"J2JMA",Length1,Length2,Phase1,Phase2,
         0,Input_Price_Customs,0,INDICATOR.bar) );
 }
//---- -----------------------------------------------------------+
Para un funcionamiento normal de la media móvil deben estar abiertos ambos gráficos. Observe que los datos históricos en ambos gráficos deben ser todos de un mismo bróker.
Respecto a la última media móvil, deber recordarse que tal y como indica la aparentemente indicativa naturaleza de la tendencia, adjuntarla a un asesor experto no tiene sentido. No importa las maravillas que pueda prometer, no ocurrirá en la vida real. La media móvil se recalcula no en la última barra del periodo de tiempo actual, sino en la última barra de un periodo de tiempo mayor. Múltiples intentos de esta tarea de Sísifo, como se esperaba, no trajeron ningún resultado.
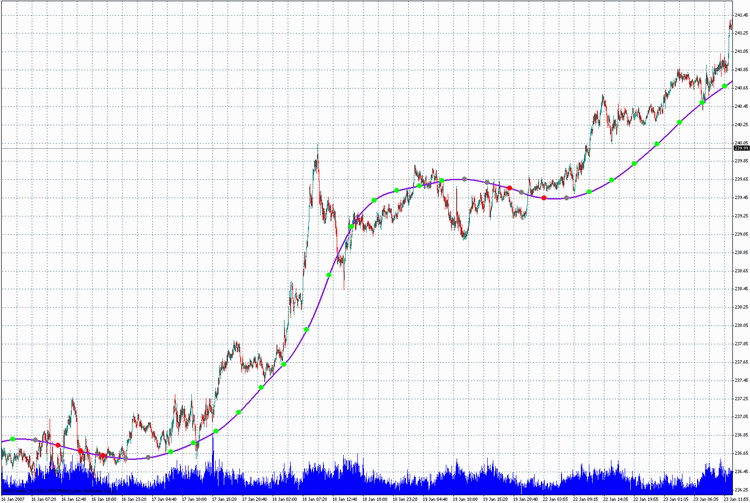
En este caso debemos explicar el punto principal del algoritmo, que está en los fundamentos de este indicador. Los valores por los que se crea el indicador se toman de las barras del periodo de tiempo mayor. Después de ajustar el precio se calculan los datos sin procesar, se transfieren los valores obtenidos a un periodo de tiempo más pequeño, se añaden los valores intermedios que faltan del periodo de tiempo menor mediante el método de la interpolación lineal. Pero como el gráfico tiene la forma de una línea poligonal querríamos naturalmente ajustarla. Esto se hace en este indicador.
Después de dichas transformaciones, esta curva adopta una forma más agraciada, pero todavía se calcula por el número de barras de un periodo de tiempo menor, equivalente a una vela de un periodo de tiempo mayor. Y finalmente, debe recordarse que la capacidad de poner código de programa adicional en un archivo mqh es especialmente conveniente al crear no solo indicadores, sino también expertos. Permite ahorrar una gran cantidad de trabajo, nos libera de la rutina y hace que la programación sea un trabajo muy fascinante e interesante.
/*
//----+ - - - - - - - - - - - - - - - - - - - - - - - - - - - - - - -+
//Version  July 1, 2006                                              |
Editing   Nikolay Kositsin  15.06.2006  farria@mail.redcom.ru        |
//----+ - - - - - - - - - - - - - - - - - - - - - - - - - - - - - - -+
Building a moving average on the current timeframe based on another,
larger timeframe. Attention!!! Indicator values are recalculated not
on the last bar, but on the number of bars, equivalent to a
candlestick of the large timeframe!

For the operation of the indicator place files
JJMASeries.mqh
PriceSeries.mqh
HTF_Channal.mqh
into folder (directory): MetaTrader\experts\include\
J2JMA.mq4
Heiken Ashi#.mq4
into folder (directory): MetaTrader\indicators\
*/
//+------------------------------------------------------------------+
//|                                            J2JMA channel_htf.mq4 |
//|                            Copyright c 2005, GS  Conversion only |
//|                    http://www.gustis.narod.ru/;     gsb51@mail.ru |
//+------------------------------------------------------------------+
#property copyright "  Copyright c 2005, GS  Conversion only"
#property link      " http://www.gustis.narod.ru/;     gsb51@mail.ru"
//---- drawing the indicator in the main window
#property indicator_chart_window
//---- number of indicator buffers
#property indicator_buffers  6
//---- indicator colors
#property indicator_color1 BlueViolet
#property indicator_color2 Gray
#property indicator_color3 Gray
#property indicator_color4 Lime
#property indicator_color5 Red
#property indicator_color6 Gray
//---- width of indicator lines
#property indicator_width1 3
#property indicator_width2 0
#property indicator_width3 0
#property indicator_width4 1
#property indicator_width5 1
#property indicator_width6 1
//---- style of indicator lines
#property indicator_style1 0
#property indicator_style2 4
#property indicator_style3 4
//---- INPUT PARAMETERS OF THE INDICATOR
//Parameters of custom indicator iCustom
extern int Length1 = 5;   // depth of the first smoothing
extern int Length2 = 5;   // depth of the second smoothing
// parameter of the first smoothing, changing within limits -100 ... +100,
//influences the quality of the transient process;
extern int Phase1  = 100;
// parameter of the second smoothing, changing within limits -100 ... +100,
//influences the quality of the transient process;
extern int Phase2  = 100;
//Choosing prices, based on which the indicator is calculated
extern int Input_Price_Customs = 0;
/*
//---- INPUT PARAMETERS HTF +--------------------------------------------+
extern int  TFrame_Period = 240; // The larger period in minutes
extern int         Smooth = 48;  // smoothing of the moving average
extern bool Trend_Visible = true;// visualization of the trend indication
// minimal speed of the moving average, considered as a trend
extern int  Trend_Minimum = 5;
extern int         Shift  = 0;   // shift of the indicator along the time axis
*/
//---- declaration of the function digits() to set up the accuracy format
// (number of signs after the decimal point) for the visualization of the
// indicator values
int digits(){return(Digits);}
//---- setting the indicator parameters, which will be invisible on the chart
int EmptyValue=0;
string Label="J2JMA";
//---- inserting into the indicator text its main text
#include <HTF_channel.mqh>
//---- declaration of the function INDICATOR
//---- reference to the source indicator to retrieve source values
double INDICATOR(int INDICATOR.bar)
 {
  return(iCustom(NULL,TFrame_Period,"J2JMA",Length1,Length2,Phase1,Phase2,
         0,Input_Price_Customs,0,INDICATOR.bar) );
 }
//-------------------------------------------------------------------+
Conclusión
En este artículo hemos analizado la creación de gráficos tricolores y medias móviles tricolores en base a los fragmentos de código disponibles que se colocaron en los archivos mqh. Usando el procedimiento descrito anteriormente para la creación de indicadores tricolores y usando los ejemplos dados como plantillas, puede crear fácilmente indicadores análogos basados en cualquier media móvil y oscilador. Usando este método puede también crear indicadores, visualizar datos de otros periodos de tiempo, que pueden ser más convenientes cuando se colocan en un gráfico, permitiendo observar los procesos que tienen lugar en distintas escalas de tiempo simultáneamente.
El archivo zip NK_library.zip contiene más de un centenar de indicadores escritos usando distintos algoritmos de ajuste. Estos indicadores son más que suficientes para aprender a usar los ejemplos descritos anteriormente para la escritura de otros indicadores análogos. Todos los indicadores del archivo zip con las versiones de la función de ajuste funcionan con asesores expertos sin errores. Guarde los indicadores del archivo zip en la carpeta de una terminal de cliente de MetaTrader 4: \MetaTrader\EXPERTS\indicators. Las funciones de ajuste y los fragmentos de código del programa están en la carpeta INCLUDE. Todos los archivos de esta carpeta deben guardarse en la carpeta del terminal de cliente de MetaTrader 4: \MetaTrader\EXPERTS\INCLUDE.
Traducción del ruso hecha por MetaQuotes Ltd.
Artículo original: https://www.mql5.com/ru/articles/1451
 ABC del trading en Forex
 Promediación efectiva de algoritmos con retraso mínimo: Uso en indicadores
 Transferir el código de un indicador al código de un asesor experto. Estructura del indicador
 MetaTrader 4 trabajando con antivirus y cortafuegos
- Aplicaciones de trading gratuitas
- 8 000+ señales para copiar
- Noticias económicas para analizar los mercados financieros
Usted acepta la política del sitio web y las condiciones de uso